In-House Designer vs Design Agency vs Design Subscription
In-House Designer vs Design Agency vs Design Subscription
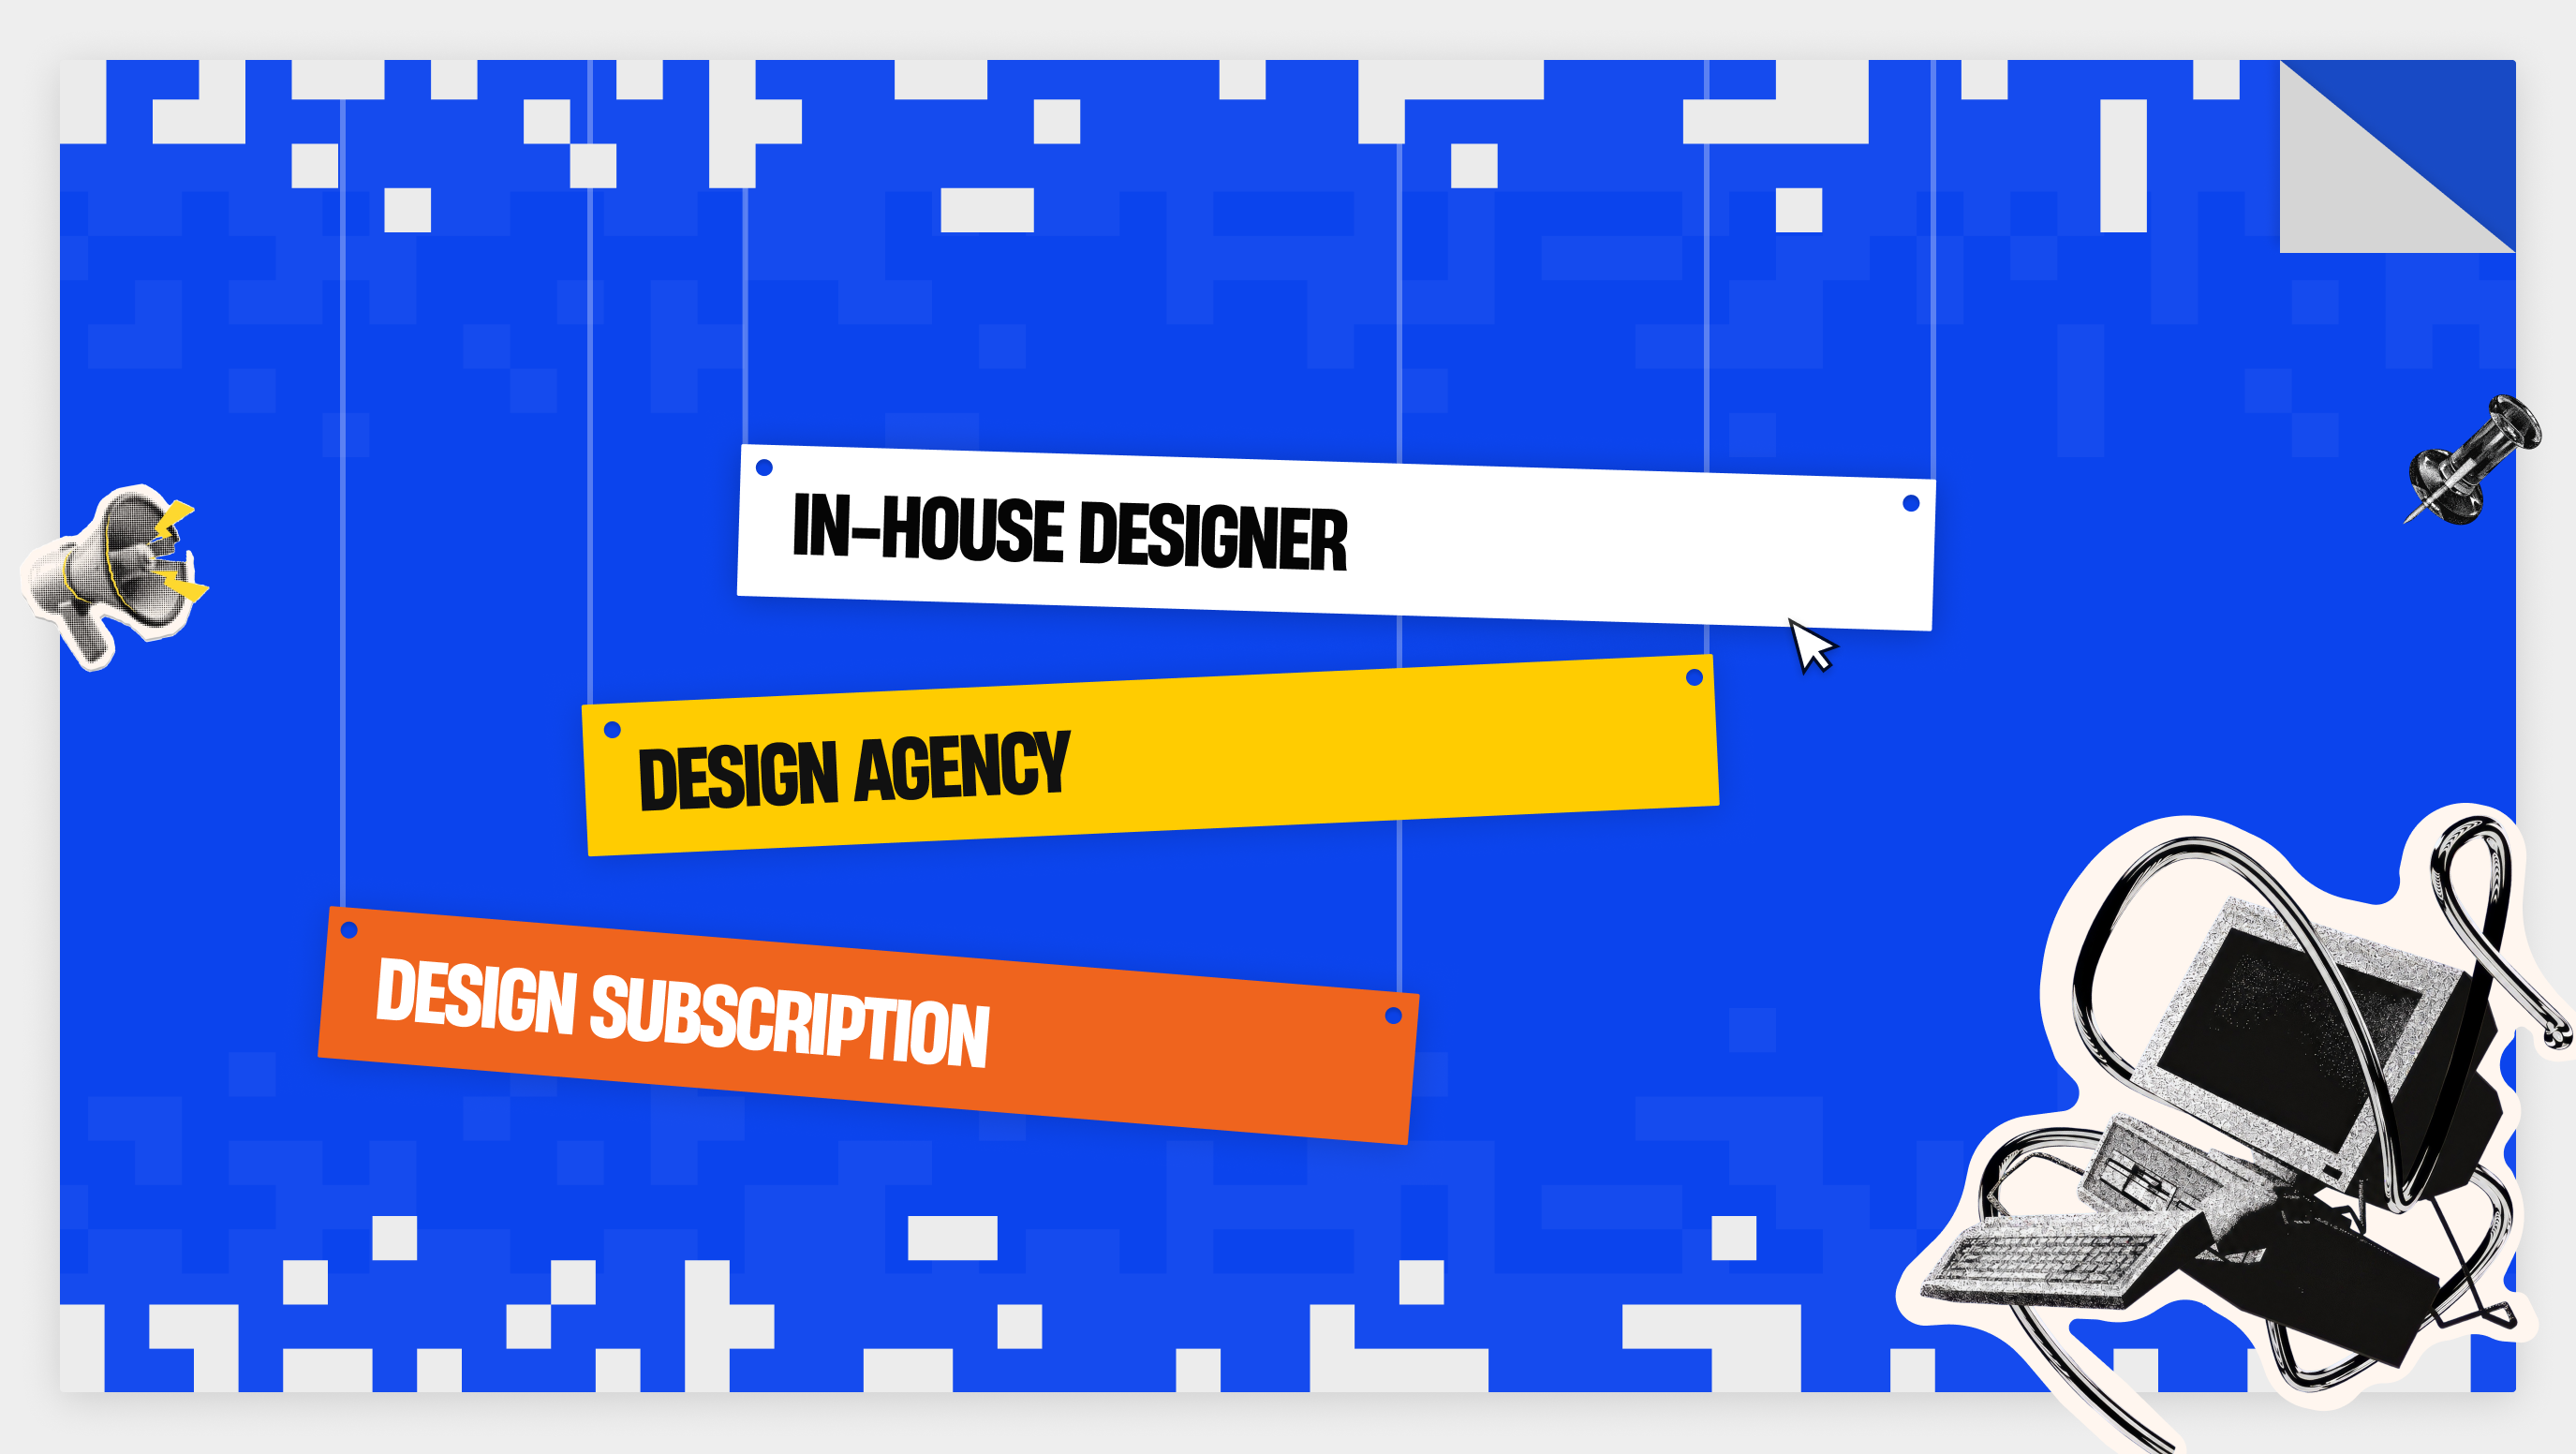
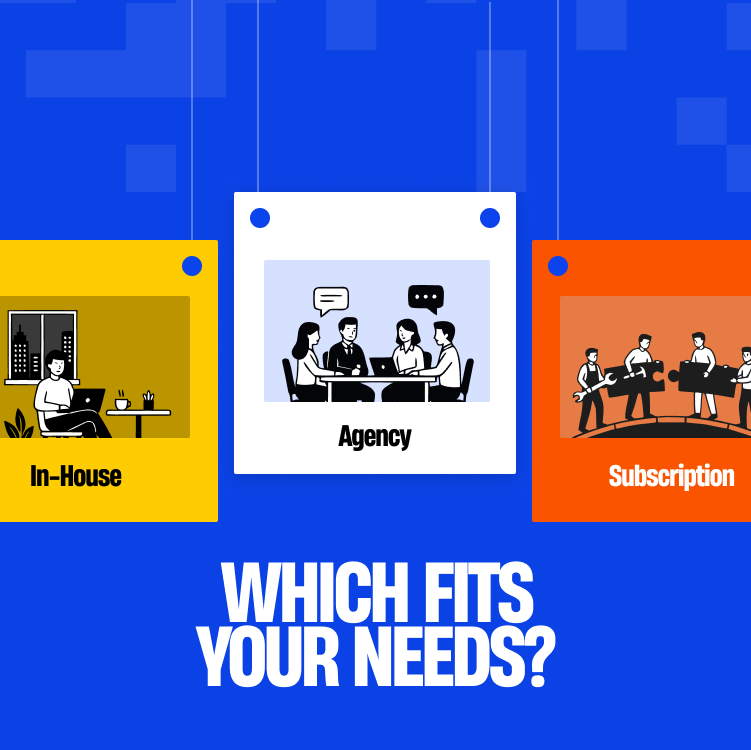
Choose an in-house designer when design work fills a full week, every week. Choose an agency when the work is a defined project with an end date. Choose a subscription when small and medium requests arrive steadily and you can brief them. In the US, an in-house designer costs about $152,000 a year with benefits, the average agency project on Clutch is $56,303, and Designjoy's subscription costs $4,995 a month.
Wage and benefit figures come from the US Bureau of Labor Statistics, hiring time from SHRM's 2026 benchmark, and turnover cost from Gallup. Agency prices come from Clutch's pricing guide, and subscription prices from Designjoy's site and a Superside roundup. Superside is a vendor, so treat its ranges as ballparks.
Key takeaways
- Benefits add about 46 cents for every wage dollar for full-time US private-sector workers, before recruiting, software and management time.
- The median nonexecutive hire takes 39 calendar days to fill, and Gallup puts replacing a leaver at half to two times annual salary.
- Clutch lists $100 to $149 an hour for US design agencies and $25 to $49 for agencies in India and the Philippines.
- In a design subscription, unlimited means an unlimited queue of requests, usually worked one to three at a time.
What does an in-house designer really cost?
The US Bureau of Labor Statistics reports a median annual wage of $104,000 for web and digital interface designers in May 2025, across about 132,700 jobs. That figure is wages only. It excludes health insurance, paid leave, payroll taxes, equipment and software.
What do benefits add?
BLS employer cost data for June 2026 shows full-time private-sector workers cost $54.00 an hour in total: $36.97 in wages and $17.03 in benefits. Benefits are 31.5% of the total. Applying that ratio to a $104,000 salary gives roughly $152,000 a year. That is our estimate, before recruiting, software and management time.
What do hiring and turnover add?
SHRM's 2026 benchmark, covering more than 4,600 organizations, puts median time-to-fill at 39 calendar days for nonexecutive roles. Gallup's 2019 analysis estimates that replacing an employee costs one-half to two times their annual salary. For a $104,000 designer, that is $52,000 to $208,000, and the figure is a general estimate across roles.
What does an in-house designer do better?
An in-house designer builds product context. They join the same standups as engineers and product managers, know why a screen works the way it does, and can review a build the day it ships. That context grows with every release.
Where does a single hire fall short?
One designer brings one set of skills. Research, visual design, motion and front-end handoff rarely sit in the same person at senior level. Work also stops when they're on leave, and a quiet month still costs a full month of salary.
What does a design agency cost, and what do you get?
What does Clutch report for agency pricing?
Clutch's design pricing guide reports an average agency project cost of $56,303, a typical timeline of 11 months and an average monthly cost of $5,102. UX/UI design projects typically cost between $10,000 and $49,999.Hourly rates depend on location. The same guide lists $100 to $149 an hour for US agencies, $50 to $99 for Canada, Poland and Spain, and $25 to $49 for India and the Philippines. Its headline hourly average of $25 to $49 sits beside those figures, so read the location table before you budget.
What do you get for that price?
An agency gives you a team: designers, often a researcher and a project manager, working to a scope and a deadline. You can start a project without a hiring cycle, and you can bring specialist skills such as research, design systems or motion for exactly as long as the work needs them.
Where does the agency model break down?
Clutch notes that fixed-price projects need a thorough scope and leave little room for extra iterations or deliverables without a price change. The agency also rebuilds product context at the start of each project, and a long gap between projects loses some of it.
How does a design subscription work, and what does it cost?
What does "unlimited" mean in a design subscription?
A design subscription charges a flat monthly fee for a queue of requests. Superside's roundup says unlimited services carry limits: in the most common model, requests are worked one at a time, and higher tiers handle two or three at once. Revisions usually continue until you approve the result.
What do subscriptions cost?
Designjoy lists one plan at $4,995 a month: one request at a time, average delivery of 48 hours, and pause or cancel anytime. That is $59,940 a year.
Superside's roundup gives Designjoy's range as $4,995 to $7,995, with graphic-focused plans from Design Pickle and Penji between $499 and $1,695. Growmodo, which adds UI design and web development, runs from $1,795 for one dedicated designer to $8,975 for a team of five.
Where does a subscription fit, and where does it stop?
Subscriptions work for a steady flow of landing pages, feature screens and marketing assets, with one person on your side briefing each request. Designjoy's own FAQ shows the limits: larger requests are split into pieces delivered every 24 to 48 hours, and 3D, animation and video are excluded.
How does Hatypo handle subscriptions?
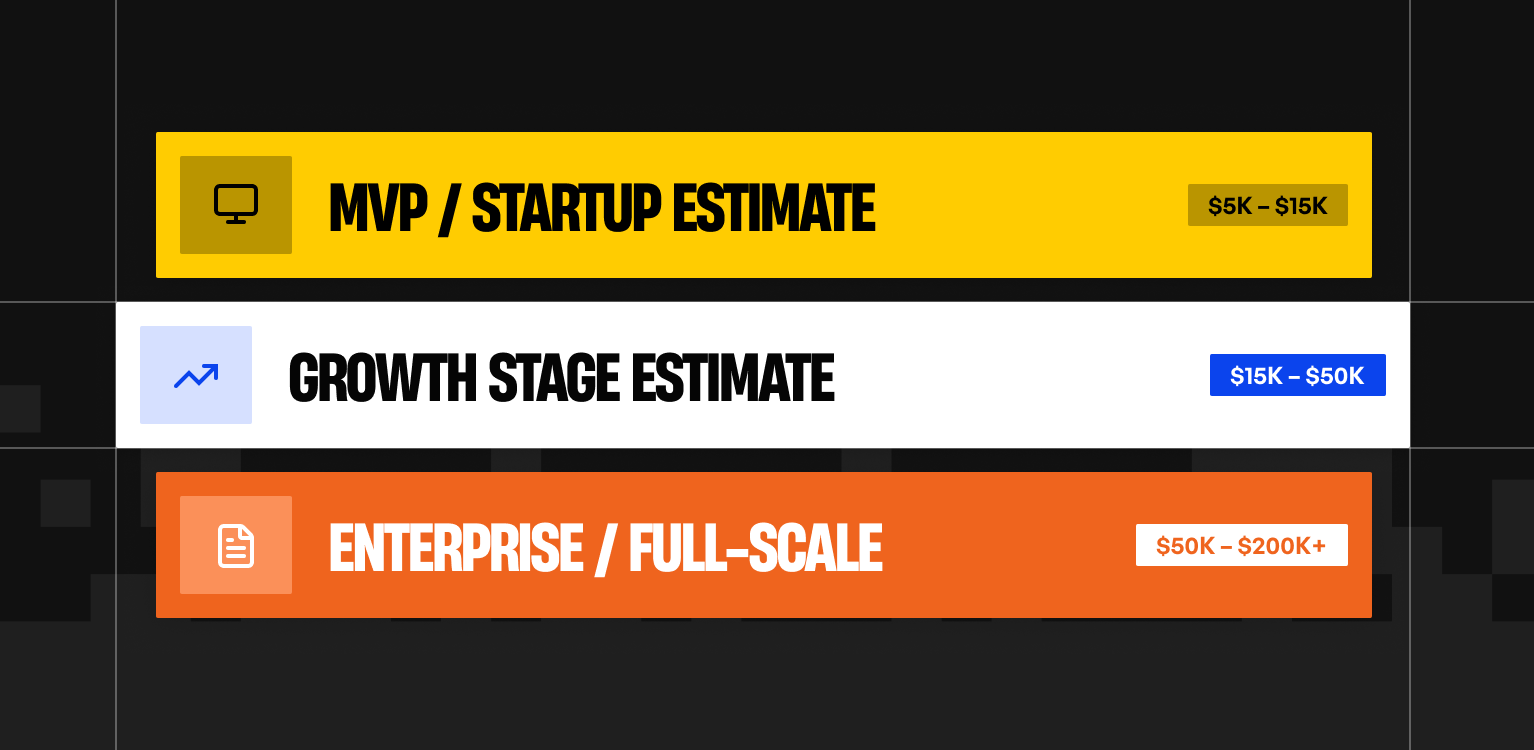
Hatypo works in two models: project-based and subscription. Project-based work starts at $3,000 and the price follows the scope. Our subscription suits agencies that want to collaborate with us over the long term.
How do an in-house designer, a design agency and a subscription compare?
The table puts the three models on the same factors. Cost figures are US-based and come from the sources above. The in-house figure is our estimate from BLS data.
When should you pick an in-house designer vs design agency vs subscription?
When does an in-house designer make sense?
Hire in-house when you can fill about 40 hours of design work every week for the next 12 months, and someone senior can set direction. As a rule of thumb, below that load you pay for idle time, and above it one designer becomes the bottleneck.
When does an agency make sense?
Hire an agency for a new build, a redesign or a specialist task with a clear end date, especially when no one on your team can lead design. You get a team and a deadline. Expect to spend the first weeks passing on product context.
When does a subscription make sense?
Choose a subscription when requests arrive steadily and each one is small enough to finish in a day or two: landing pages, feature screens, marketing assets. You need someone to write clear briefs. Open-ended discovery research and large product redesigns fit a project better.
Can you combine models?
Yes. Common setups are an in-house lead plus an agency for launches, and an agency-built first version handed to a subscription or a full-time hire once the product has traction. The in-house lead should join agency design reviews so the handoff holds.
What four questions settle the decision?
How many hours of design work will you have each week?
Count planned work over the next 12 months. A full week of work suits an in-house hire. A few days a week suits a subscription. An uneven load of large projects suits an agency.
Who briefs and reviews the work?
Every model needs a person on your side who can say what good looks like. Without that person, an agency can supply a lead of its own. A subscription depends on the quality of your briefs.
Which skills does the work need?
List the skills the work needs, such as research, visual design, motion and front-end handoff, and mark how many one hire could cover. The gaps tell you where an agency or a subscription needs to fill in.
What happens when the work stops?
Replacing an in-house designer costs half to two times annual salary, per Gallup's estimate. An agency project ends at delivery. A subscription pauses or cancels on the provider's terms, and Designjoy lets you pause anytime.
Heading 1
Heading 2
Heading 3
Heading 4
Heading 5
Heading 6
Lorem ipsum dolor sit amet, consectetur adipiscing elit, sed do eiusmod tempor incididunt ut labore et dolore magna aliqua. Ut enim ad minim veniam, quis nostrud exercitation ullamco laboris nisi ut aliquip ex ea commodo consequat. Duis aute irure dolor in reprehenderit in voluptate velit esse cillum dolore eu fugiat nulla pariatur.
Block quote
Ordered list
- Item 1
- Item 2
- Item 3
Unordered list
- Item A
- Item B
- Item C
Bold text
Emphasis
Superscript
Subscript
Authors :

Webflow vs Framer for SaaS Marketing Sites in 2026
By Oryza Sativa, Front End Developer at Hatypo Studio · Last updated: October 2026 · 8 min read · Websites · Development · Strategy
For most SaaS marketing sites in 2026, Webflow Premium fits content-heavy sites and Framer Pro fits design-led sites with a smaller library. Webflow Premium costs $25 a month billed yearly and holds 20,000 CMS items. Framer Pro costs $30 a month billed yearly and holds 2,500 CMS items, extendable to 40,000 with paid add-ons. Neither platform exports a full working site.
Prices and limits come from Webflow's and Framer's own pricing pages, read in October 2026, plus Webflow's May 2026 plan announcement. Performance thresholds come from Google's web.dev and the 2025 HTTP Archive Web Almanac. Third-party trackers fill gaps, and the article names them when it uses them.
I'm Oryza Sativa, a Front End Developer at Hatypo Studio. Hatypo has delivered 20+ dashboard and SaaS projects since 2021 and builds client websites in both Webflow and Framer. This comparison covers what a developer meets after the design is signed off: limits, code, performance, and hand-off.
Key takeaways
- Webflow merged its CMS and Business plans into Premium on May 13, 2026, and the plan now carries 20,000 CMS items instead of 2,000.
- Framer Pro's 2,500-item cap is the limit a content-heavy SaaS site hits first, and each extra 10,000 items costs $20 a month.
- At list price, one designer plus two content editors costs about $55 a month on Webflow and $50 on Framer, before add-ons.
- Webflow exports HTML and CSS without CMS content, and Framer exports nothing, so treat either choice as long-term.
- A/B testing starts at $299 a month on Webflow and costs $50 per 500,000 events on Framer, so price experiments before you commit.
What changed in Webflow and Framer pricing in 2026?
Webflow rebuilt its Site plans on May 13, 2026. The old CMS and Business plans became one Premium plan at $25 a month billed yearly, or $39 billed monthly. CMS items rose to 20,000, and the CMS item add-ons disappeared.
Existing sites move at their next renewal on or after June 29, 2026. Sites in Freelancer or Agency workspaces, and sites on legacy discounts from 2022 or earlier, move on or after November 16, 2026. Business-plan sites should check bandwidth: Premium includes 50 GB, where Business included 100 GB.
Framer's own pricing page now lists Free, Basic at $10, Pro at $30 and a custom Enterprise plan. Cost trackers recorded the $100 Scale plan leaving the lineup on June 16, 2026, so older comparisons may list a plan that no longer exists.
Framer also changed editor pricing in May 2026. Extra editors now cost $20 a month on both Basic and Pro, and CMS-only content editors cost $10, with viewers free.
How does Webflow vs Framer pricing compare for a SaaS marketing site?
The table compares Webflow Premium and Framer Pro, the plcans a SaaS marketing site with a blog, integration pages and a changelog would buy. All prices are list prices in USD with yearly billing unless noted, read from each vendor's pricing page in October 2026.
Sources: Webflow pricing, Framer pricing.
For a small team, the seat arithmetic decides the monthly bill. One designer plus two content editors costs $55 a month on Webflow ($25 plus two Limited seats at $15) and $50 on Framer ($30 plus two content editors at $10). Both figures exclude add-ons and tax.
Experiments and languages move the total more than seats do. A/B testing on Webflow starts at $299 a month, billed by page views, and Framer's Convert add-on costs $50 per 500,000 events. Each added language costs $20 a month on Framer, while Webflow Localize starts at $9 and scales with locales.
Which platform fits a SaaS site's CMS volume?
Take an example site with 150 blog posts, 80 integration pages, 60 changelog entries and 30 comparison pages. That is 320 CMS items, well inside Framer Pro's 2,500 and Webflow Premium's 20,000. The platforms separate when the content plan grows toward thousands of generated pages.
Framer Pro stops at 2,500 items and 10 collections. Past that, add-ons cost $20 per 10,000 items and $40 per 10 collections, capped at 40,000 items and 40 collections. Beyond the cap, limits are negotiated on Enterprise.
Webflow Premium carries 20,000 items and 40 collections, and no item add-ons exist anymore. Unpublished drafts still count toward the cap, according to one Webflow agency's 2026 guide, and a full plan blocks new items rather than edits.
A site that plans programmatic pages, such as one landing page per integration, per use case or per city, should start on Webflow or budget Framer add-ons from day one. A site that publishes a few hundred items will not meet either limit.
How do Webflow and Framer compare on performance and SEO?
A site that plans programmatic pages, such as one landing page per integration, per use case or per city, should start on Webflow or budget Framer add-ons from day one. A site that publishes a few hundred items will not meet either limit.
The 2025 Web Almanac, using July 2025 field data, found 48% of mobile sites and 56% of desktop sites passing all three. A platform sets the starting point, and what each site adds on top decides the result.
Each vendor publishes its own claims, and you should test them on your own build. Framer describes traffic-aware pre-rendering, static generation and edge image conversion to WebP and AVIF. Webflow describes AWS hosting behind a Cloudflare CDN and says it reaches 95% of the world in under 50 milliseconds.
On SaaS sites the risk often arrives after launch. Google's web.dev says tag managers can take bandwidth and main-thread time, and it has seen a correlation between tag manager size and poorer INP scores. Analytics, chat widgets and consent banners need a script budget on either platform.
Both cover the technical basics. Webflow lists custom meta tags, canonical tags, an automatic XML sitemap, robots.txt and llms.txt controls, schema markup support and per-item indexing for CMS content. Framer lists built-in SEO, sitemaps, clean metadata and llms.txt, with redirects on Pro.
Which platform is easier for marketers to edit after launch?
Webflow separates design seats from content seats. Full seats cost $39 a month, and Limited seats cost $15 for editing content or building pages with components. The Team plan costs $2,500 a month on an annual contract and adds publishing workflows, single-page publishing and 5 full seats.
Framer charges $20 a month for each additional editor and $10 for content editors who only touch the CMS, localization and on-page editing. Both paid plans cap edit seats at 10. Pro adds a staging environment and branching with previews.
Branching matters for a marketing site that ships weekly. Framer includes it on Pro, and Webflow's pricing page lists branch staging and publishing workflows under the Team plan.
Which should a SaaS team choose in 2026?
My recommendation: start a SaaS marketing site on Webflow Premium when it will publish more than 2,500 CMS items, needs more than 150 static pages, or will move to a governed team setup. The ceiling is 20,000 items, and the Team plan is the next step up.
Choose Framer Pro when the site stays under about 2,500 items, a designer owns the build, and the team wants branching and low-cost content-editor seats. At $30 a month with 10 collections, it fits a launch site, a changelog and a blog.
Whichever you pick, run three checks before launch. Price the add-ons you will need in year one. Test Core Web Vitals on a staging build with every third-party script installed. Write down who owns the site if the platform changes its pricing again.
Need help choosing or building a SaaS marketing site?
Choosing between Webflow and Framer gets easier after a short review of your content plan, your editing team and your third-party scripts.
Hatypo has delivered 20+ dashboard and SaaS projects since 2021, and projects start at $3,000 with the price following the scope.
- If you are launching a new SaaS site, we design it and build it in Webflow or Framer to match your content plan.
- If your current site is slow or converts poorly, we audit the build and fix what the audit finds.
- If your site has outgrown its first version, we plan the move to the platform that fits the next stage.
Tell us where the site stands today and we will recommend a platform: Book a consultation.
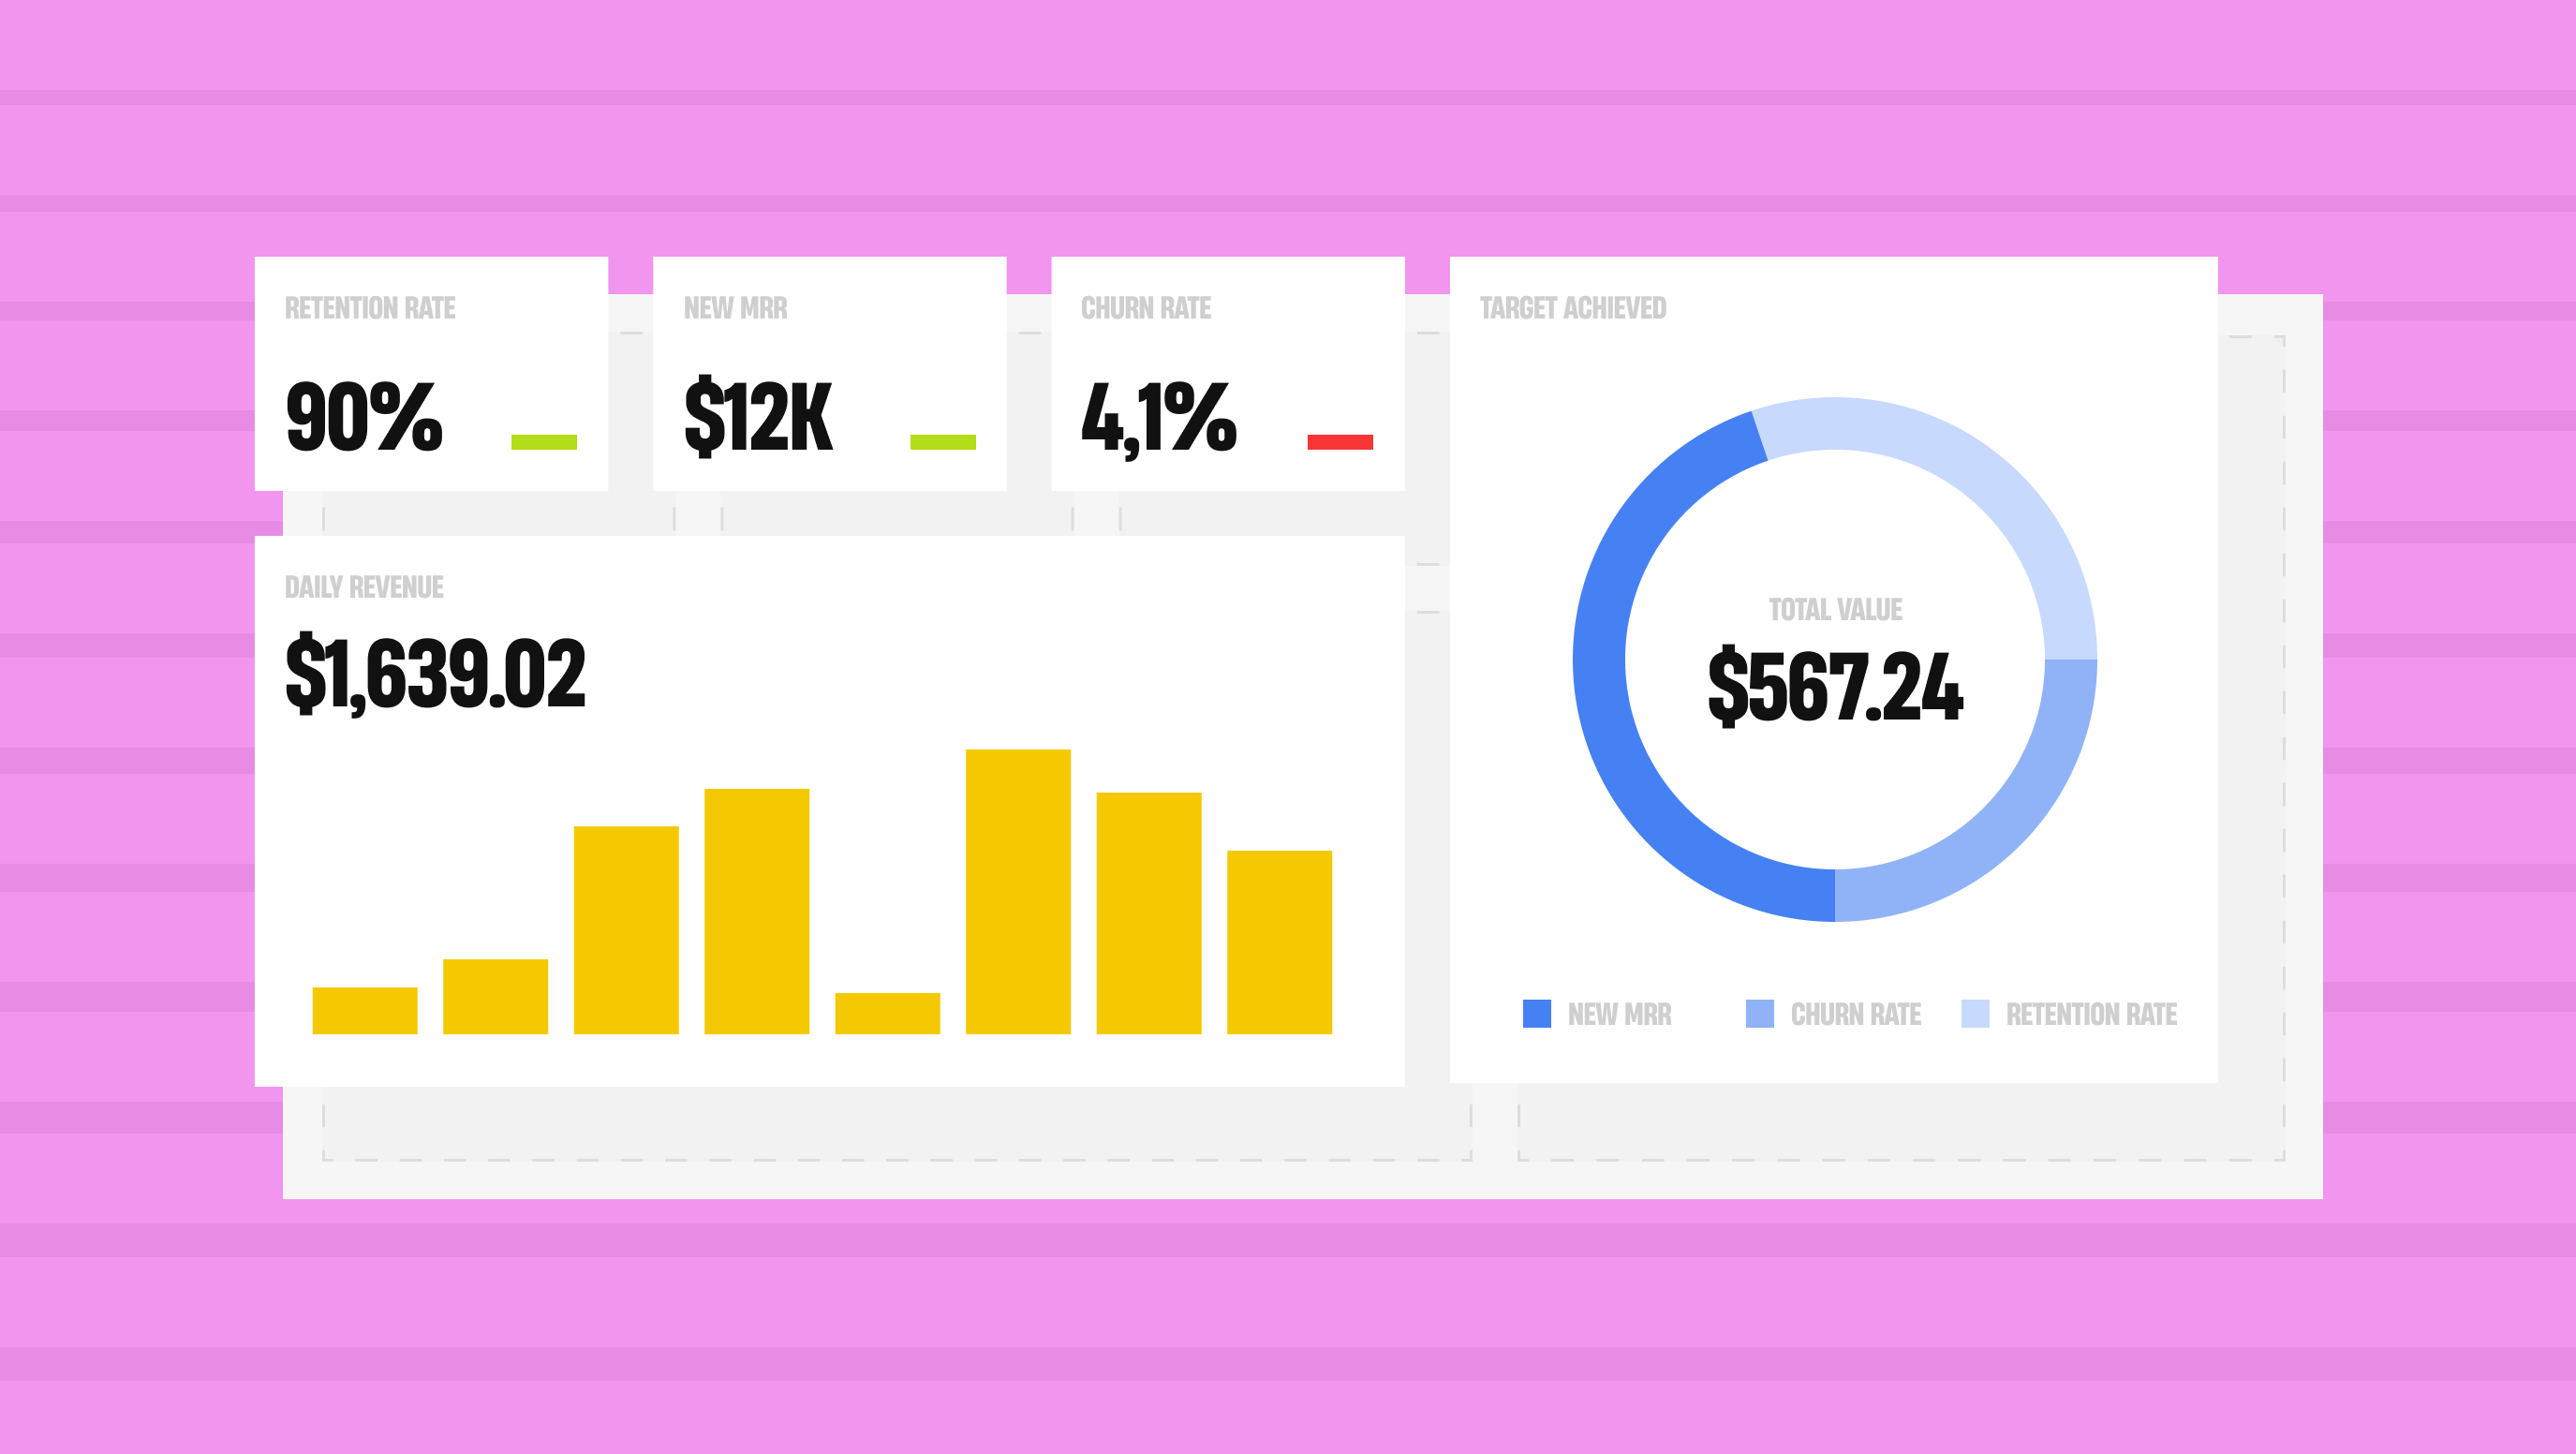
A data-heavy SaaS dashboard works when it answers one question for one audience, shows every number next to a comparison, and encodes quantities with length and position. The rest is discipline: fewer metrics per view, no decorative chart elements, colour that carries meaning but never carries it alone, and every data state designed, including empty and stale.
The 12 principles below come from our project work at Hatypo plus published research from Nielsen Norman Group, the W3C's WCAG 2.2 accessibility guidelines, and Google's Core Web Vitals thresholds for interface responsiveness.
We've delivered 20+ dashboard and SaaS projects since 2021. Most of them involved analytics screens that started simple and grew past what the first layout could hold.
What should a dashboard answer before you design a single widget?
The first 3 principles decide whether the rest matter. A beautiful dashboard that answers no particular question gets opened twice and then ignored.
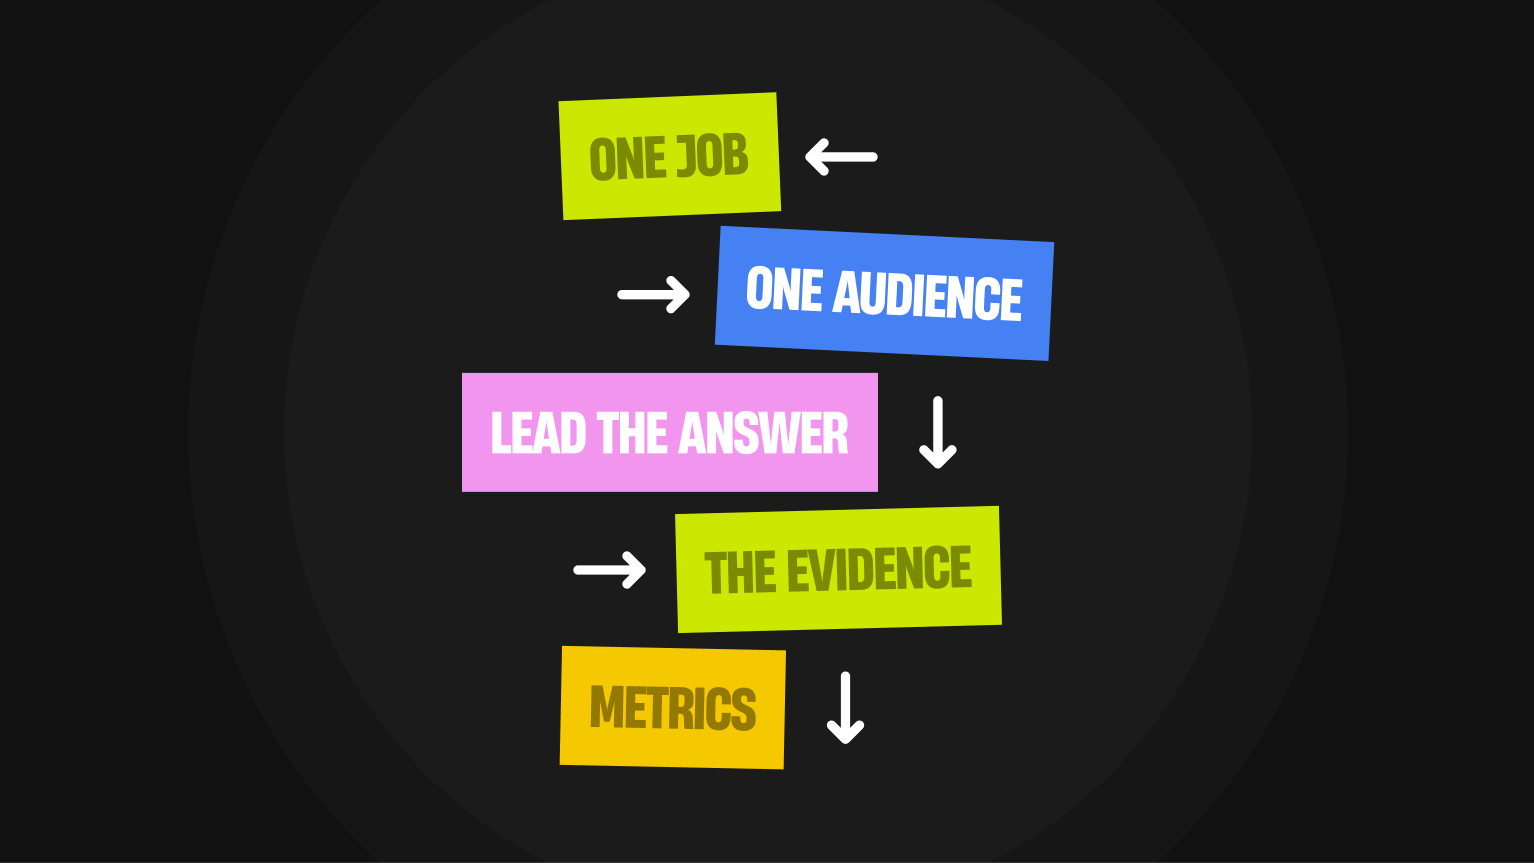
- Give the dashboard one job and one audience. A support lead watching queue health and a CFO reviewing quarterly margin need different screens, different refresh rates and different levels of detail. SAS groups dashboards into operational, analytical and strategic, and the three differ most in how often the data changes. Write the job in one sentence before you open Figma. If you can't, the dashboard isn't ready to design.
- Lead with the answer, then the evidence. Put the conclusion where the eye lands first: "Churn is 4.2%, above your 3% target" in large type, with the trend chart underneath. Users who want the raw series will scroll. Users who want the status get it in 2 seconds.
- Cap the metrics per view. We aim for 5 to 7 primary metrics on an overview, with everything else behind a tab or a drill-down. Jakob Nielsen's definition of progressive disclosure is the pattern: show the few options that serve most tasks, and put the rest one clearly labelled level down. A screen with 20 equally sized tiles has no hierarchy, so the reader has to build one.
How do you present the numbers so people read them correctly?
These 4 principles cover the part teams usually treat as decoration. It decides whether a reader gets the right answer or a plausible wrong one.
- Give every number a comparison. A churn widget reading 4.2% means nothing on its own. Add last month's 3.1% and the 3% target, and the same number now says the business is moving the wrong way. Every metric needs at least one of 3 comparisons: previous period, target, or benchmark.
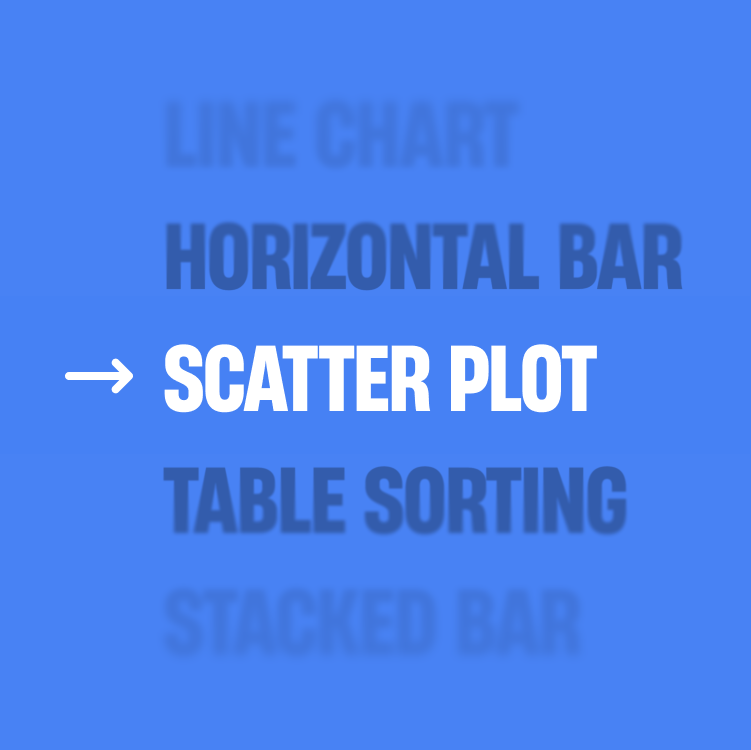
- Choose the encoding by the question. Nielsen Norman Group's guidance on dashboard visualisations is specific: length and 2D position communicate quantity fastest, because the eye processes them before conscious attention engages. Area and angle are weaker, which is why pie charts and treemaps fail at precise comparison. Use the table below as a starting point.
- Cut everything that isn't data. NN/g's rule on chartjunk is to remove elements that distract from the data. Edward Tufte coined the term in 1983. In practice: drop 3D effects, heavy gridlines, drop shadows, redundant legends and axis labels repeated on every tick. Round to 1 or 2 decimal places, because 6 decimals in a business dashboard add noise and no information.
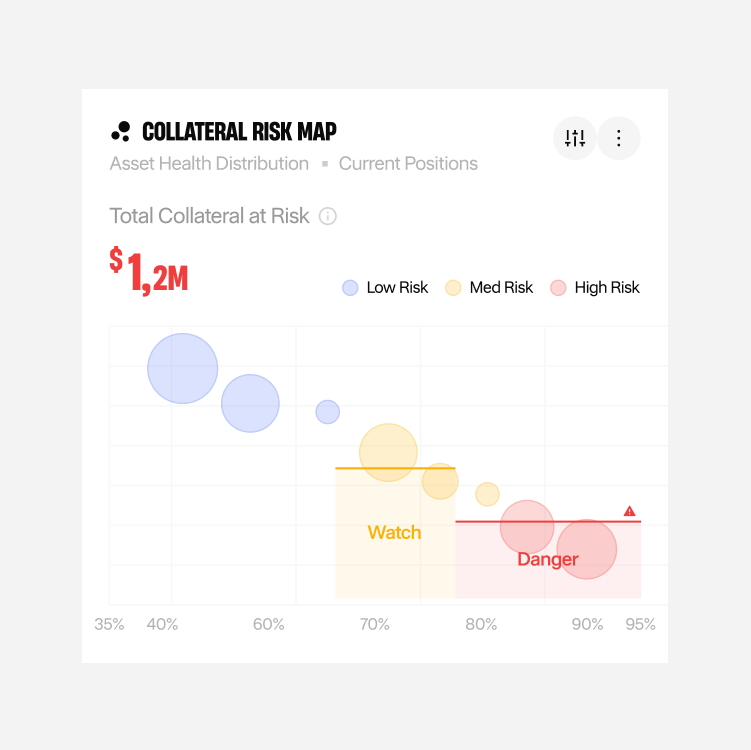
- Use colour semantically, and never alone. Pick one colour for the primary series, one for comparison, and reserve red and amber for states that need action. Around 8% of men and 0.5% of women have a colour vision deficiency, so pair colour with a label, an icon, a pattern or position. WCAG's Use of Color criterion requires exactly this.
How do you handle live data without breaking trust?
Data-heavy products fail here more than anywhere else. The happy-path screen looks fine in Figma, then production serves a half-loaded chart over a 6-hour-old cache.
- Design all 5 data states for every widget. Loading, empty, partial, stale and error. The empty state is the one teams skip, and it's the first thing a new customer sees. Write real copy for it: what the widget will show, why it's blank, and what to do next. A chart that renders an empty grid with no explanation reads as a bug.
- Make the time range and data freshness explicit. Put the active range in the widget header, not only in a filter bar at the top of the page. Add a timestamp: "Updated 14:32, 6 Oct". Teams argue over numbers that disagree, and most of the time the 2 screens are showing different ranges or different refresh times.
- Keep interaction inside the response-time limits. Nielsen's 3 limits, drawn from Miller's 1968 research, still hold: 0.1 seconds feels instant, 1 second keeps the user's flow of thought, and 10 seconds is the edge of their attention. Google's INP threshold puts good responsiveness at 200 milliseconds or less at the 75th percentile. Sorting a table or switching a filter belongs in that first band. For anything slower, show a skeleton that matches the final layout, and render each widget as its query returns rather than holding the whole screen.
How do you keep a dashboard usable as it grows?
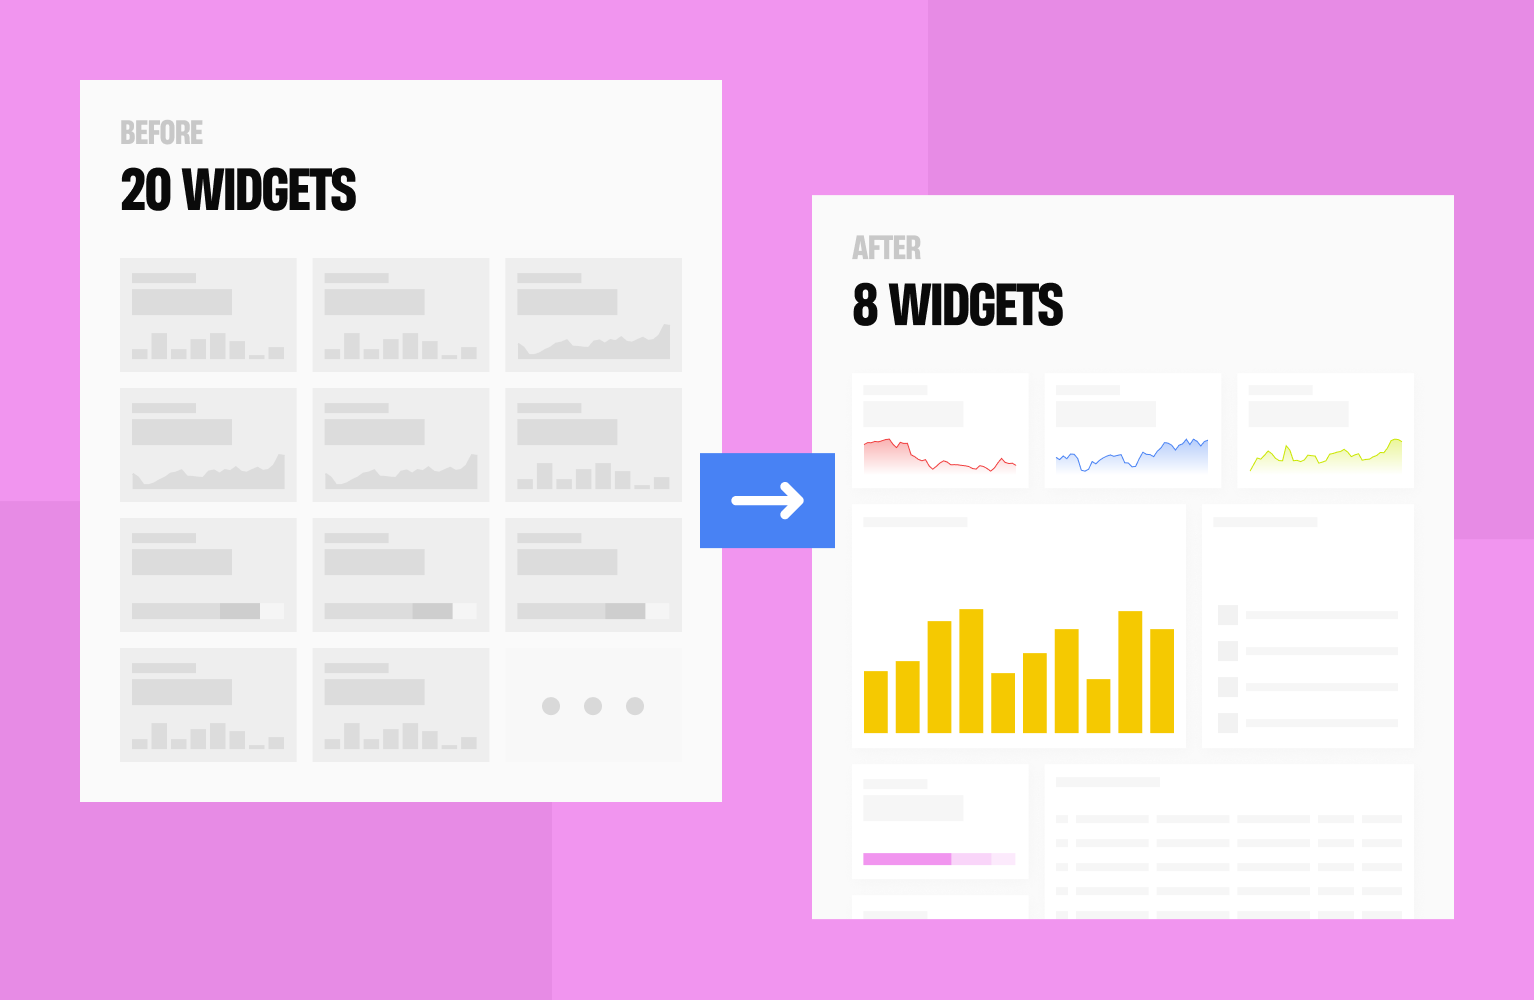
A dashboard is rarely finished. Customers ask for 1 more metric every quarter, and after 2 years the screen holds 40 widgets nobody planned together.
- Build on a small component set with accessibility in it. Define a widget shell, a metric tile, a chart container and a table, then build every new view from those. Set the rules once: text contrast of at least 4.5:1, non-text elements and chart strokes at 3:1, and interactive targets of at least 24 by 24 CSS pixels, which are the WCAG 2.2 AA thresholds. Fixing this later means touching every screen.
- Instrument the dashboard and cut what nobody opens. Log which widgets get viewed, which filters get changed and which drill-downs get clicked. In my experience a handful of widgets carry most of the use. Move the unused ones behind a tab or delete them, and run a usability session every few releases to check that people read the numbers the way you intended.
How we design with AI without losing craft?
We use AI for thinking and writing, and keep people on visual decisions. In our October 2026 survey of 11 Hatypo, Habito designers and developers, 9 use AI daily or nearly daily, 8 deliberately keep visual design AI-free, and 10 spend the time they save on deeper research. None reported lower quality. Seven of 11 have no settled rule for when AI stays off.
This article draws on our internal survey (16 responses, 11 in scope), Doshi and Hauser's 2024 Science Advances study of AI and creative writing, Microsoft Research's 2025 CHI survey of 319 knowledge workers, and Figma's 2025 AI report of 2,500 designers and developers.
I'm Raull Khaq, COO at Hatypo Studio, and Art Director at Habito, our branding studio. I oversee daily operations across our teams and ran the survey behind this article. Hatypo has delivered 250+ projects since 2021, so I see how AI use plays out in real project work.
Key takeaways
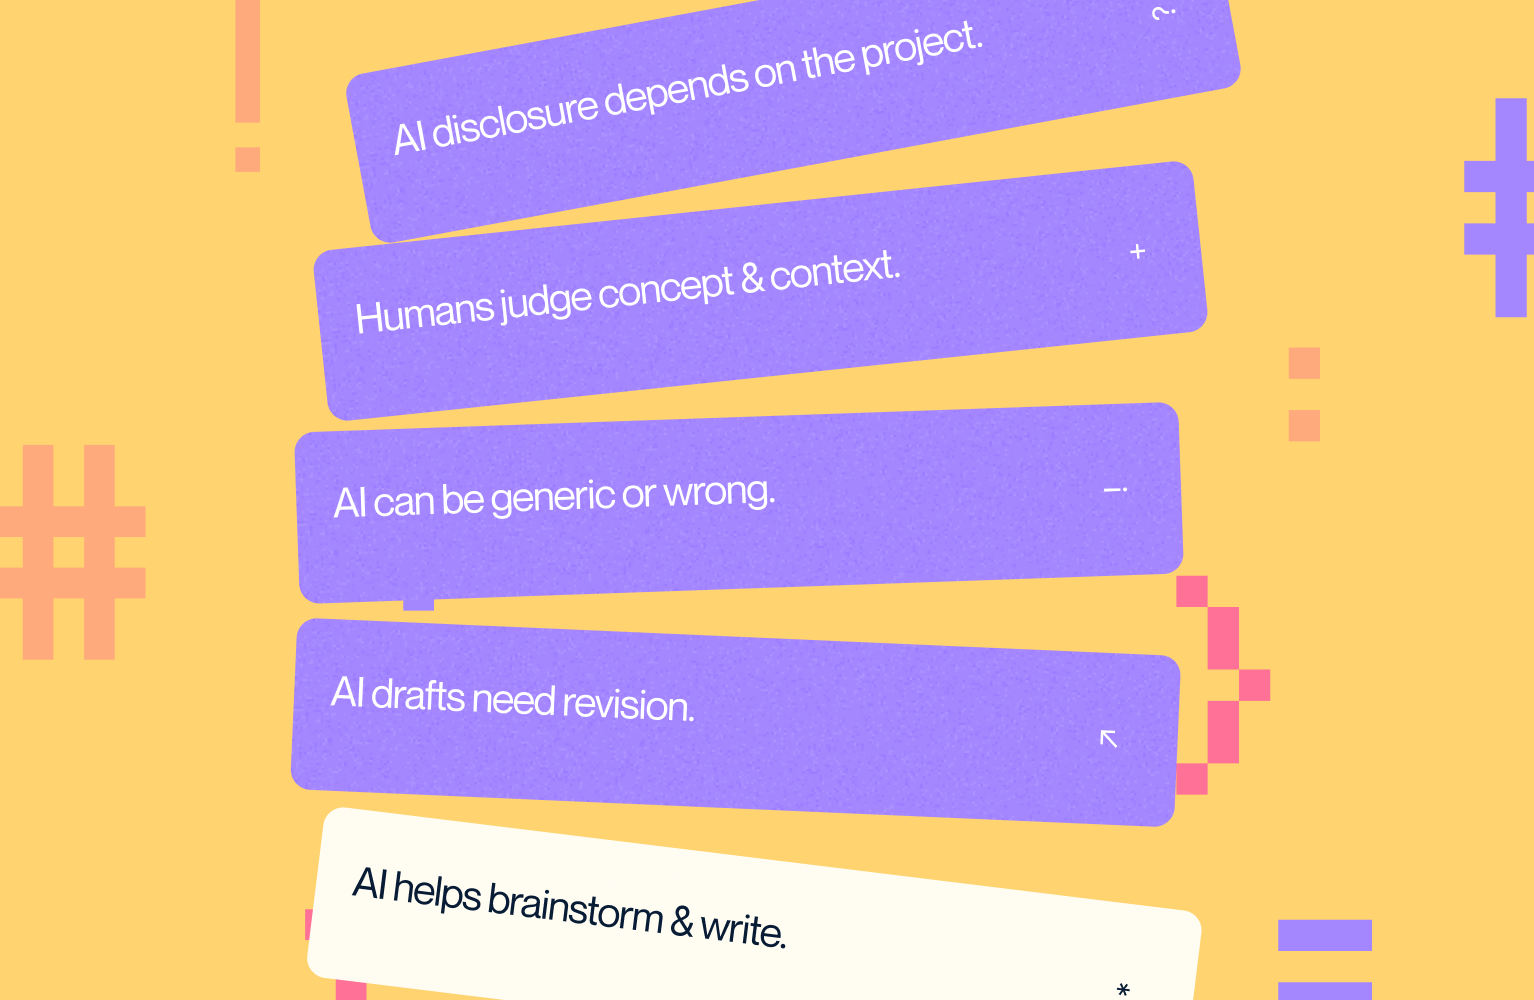
- AI helps most with brainstorming and copywriting, 4 of 11 respondents each.
- Output is a draft: reuse without edits averages 3.1 out of 5, and heavy rework averages 4.0.
- 10 of 11 have seen generic or wrong output, and 5 of them see it often.
- Craft means choosing the concept (9 of 11) and reading the client's context (7 of 11) more often than pixel detail (5 of 11).
- 8 of 11 say whether clients should be told about AI depends on the project.
How did we run the survey, and how far can the data go?
We sent a Google Form to the designers and developers at Hatypo and Habito between 9 and 12 October 2026. Of 16 responses, 5 came from project managers and account executives, so we counted the other 11: 6 UI/UX designers, 3 brand designers, 1 motion designer and 1 front end developer.
Eleven people is a small sample, so we report counts and skip percentages. The answers are self-reported, and the survey came from management, which can push answers toward the positive. Read the numbers as what our team says about its own work.
Where do we design with AI, and where do we stop?
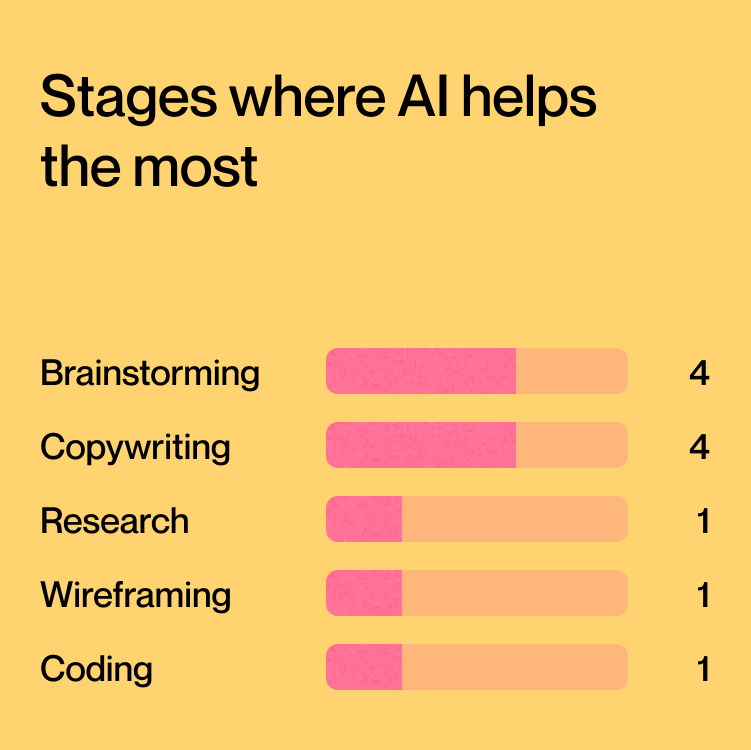
Brainstorming, research and copywriting carry most of the AI work. Four respondents named brainstorming as the stage where AI helps most, four named copywriting, and one each named research, wireframing and coding. ChatGPT (10 of 11), Claude (9), Gemini (8) and Figma AI (7) are the tools in use.
Visual design is where respondents most often stop. Eight of 11 said they deliberately avoid AI there, more than any other stage. Illustration and moodboards followed with 3 each.
The open answers repeat the pattern: AI works on questions and words, and people make the visual calls. One designer put it as a rule: anything that needs empathy for the client or user, and all visual exploration, stays human, while AI handles technical tasks.
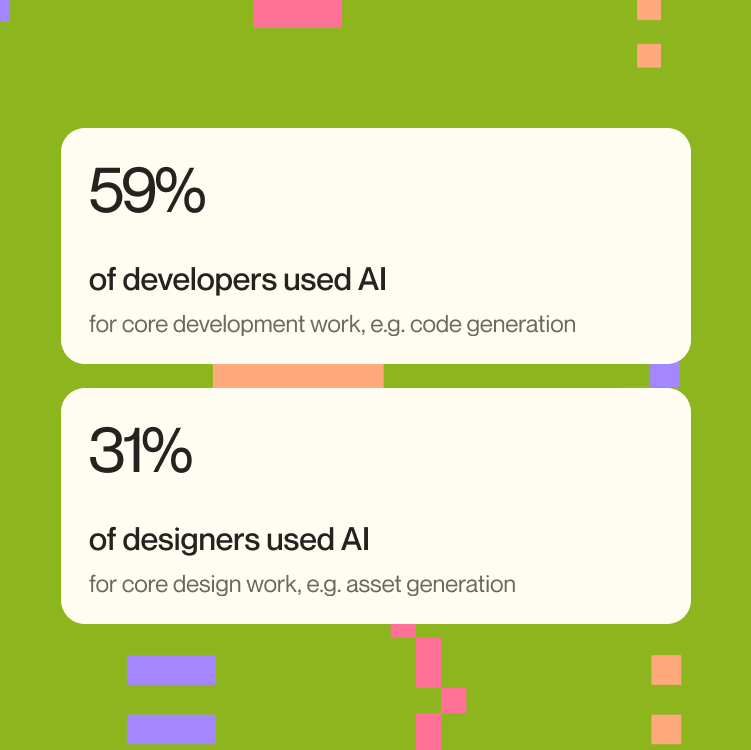
Figma's 2025 report shows a similar split by role. Of its 2,500 respondents, 59% of developers used AI for core development work such as code generation, against 31% of designers for core design work such as asset generation.

How much time does AI save, and where does the time go?
Five of 11 respondents saved 26 to 50% of their working time, four saved 11 to 25%, and two saved more than 50%. Nobody chose the 1 to 10% bracket. In the same Figma report, 78% of respondents agreed that AI significantly improves the efficiency of their work.
The saved time goes mostly into thinking. Ten of 11 spend it on deeper research, five on more iterations and five on rest. Only one respondent uses it to take on more projects.
On our team, saved hours go mostly into understanding the problem.
How often does AI output survive without edits?
Respondents rated how often they use AI output unchanged at 3.1 out of 5 on average (1 is never, 5 is always). They rated how often they rework it heavily at 4.0. Six of 11 gave rework a 4 or 5, and only 3 gave unchanged use a 4 or 5.
In practice AI gives a first version that a person finishes. Final quality still came out higher for 10 of 11 respondents (8 said slightly higher, 2 said much higher), and the eleventh saw no change.
Why does AI output look generic?
Ten of 11 respondents have met generic, wrong or derivative output, and 5 meet it often. Respondents described layouts that start to look alike across projects, with dashboards and wireframes as examples.
A 2024 experiment in Science Advances found the same pattern in writing. Writers who could pick from five AI-generated ideas wrote stories that evaluators rated 8.1% more novel, yet AI-assisted stories were more similar to each other. That suggests the risk sits at portfolio level: each piece looks fine and the set looks alike.
How do we check AI output before it ships?
Ten of 11 respondents check details by hand, 6 compare the output with references, 2 ask a teammate to review it, and 2 test it with a client or user. Peer review is the thinnest of our checks.
A Microsoft Research survey of 319 knowledge workers found that people who trust the AI more apply less critical thinking, while people confident in their own skill apply more. Three of our respondents tied the moments their craft slipped to deadlines, when there was no time to review everything AI produced.
What do our designers and developers mean by craft?
We asked respondents to pick the parts of design they count as craft. Nine of 11 picked concept selection, 7 picked sensitivity to the client's context, 6 picked design decisions, and 5 picked visual detail at the pixel level. The question asked for up to three picks and several people chose more, so read the counts as relative weight.
In their own definitions, people described craft as a good concept, care for the smallest detail, and empathy for the client or user. Craft sits in judgment more than in manual execution, which fits the finding that 8 of 11 let AI work upstream and keep visual execution in human hands.
Has AI lowered our craft, and has it raised it?
Five of 11 respondents said AI never lowered their craft, six said it did once or twice, and nobody said it did often. The reasons were specific: accepting output under deadline, results that felt unoriginal, and a concept the tool could not draw.
Respondents also described gains. They named more time for research, perspectives they had not considered, and visuals that would be hard to make by hand.
Six of 11 say AI helps them learn design skills faster, four see no difference, and one is unsure. Nobody said it slows learning, though the survey asked people to judge their own learning, which is hard to measure from the inside.
What rules keep craft in place?
Four of 11 have a personal rule about when AI is allowed, three are building one, and four have none. The rules differ: no AI for logo design; empathy and visual exploration stay human; execution and the final decision stay with the designer; and AI is acceptable when deadlines are tight or client needs are unreasonable.
The things nobody hands to AI overlap. Three respondents named decision-making and two named logo design. Others named visual exploration, judging a full design from a brief, and what one developer called the soul of the work.
What working rules does the survey support?
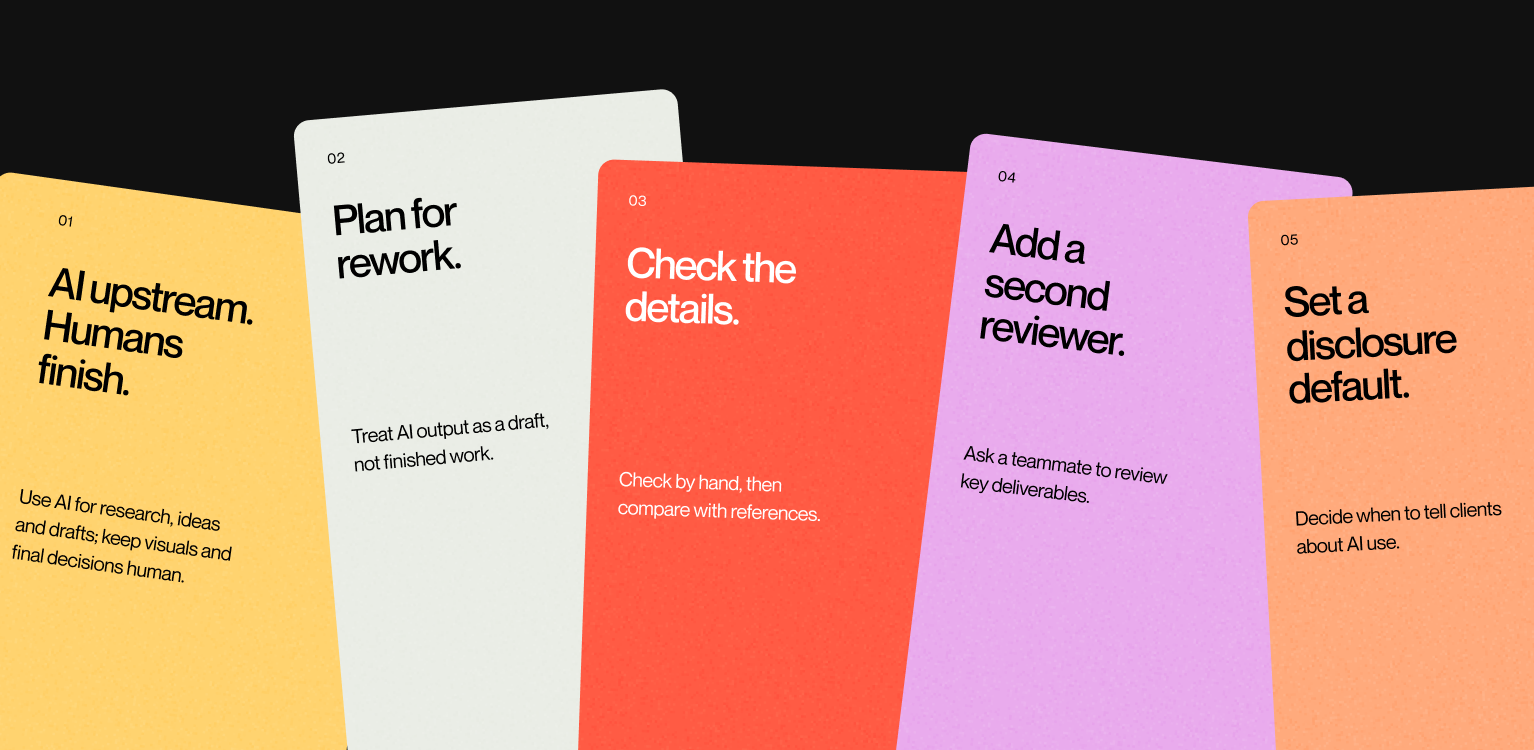
- Use AI upstream and finish by hand. Research, brainstorming and first-draft copy go to AI. A person owns visual execution and the final decision, and 8 of 11 respondents already keep visual design AI-free.
- Plan for rework. Heavy rework averages 4.0 out of 5, so schedule revision time and do not count AI output as done work.
- Keep a minimum check under deadline. Every AI output gets a manual detail check and one comparison with references. Ten of 11 respondents already do the first, and 6 do the second.
- Add a second reviewer on key deliverables. Only 2 of 11 ask a teammate to review AI output, which leaves most checks with the person who made the work.
- Set one default for telling clients. Eight of 11 say disclosure depends on the project, 2 say always and 1 says it is not needed. Without a default, each project gets a different answer.
How can Hatypo help with your product design?
If you want to know where a design studio uses AI on your project and where it does not, we can walk you through our process on a call.
Hatypo has delivered 250+ projects since 2021, and projects start at $3,000, with the price following the scope.
- If you are starting a new product or website, we design it from research through developer-ready files.
- If your current interface underperforms, we review it and propose a redesign scope.
- If your product has outgrown its first version, we rework the key flows and the design system.
Tell us where you are and we will recommend a scope: Book a consultation.