SaaS Dashboard Design: 12 Principles for Data-Heavy Products
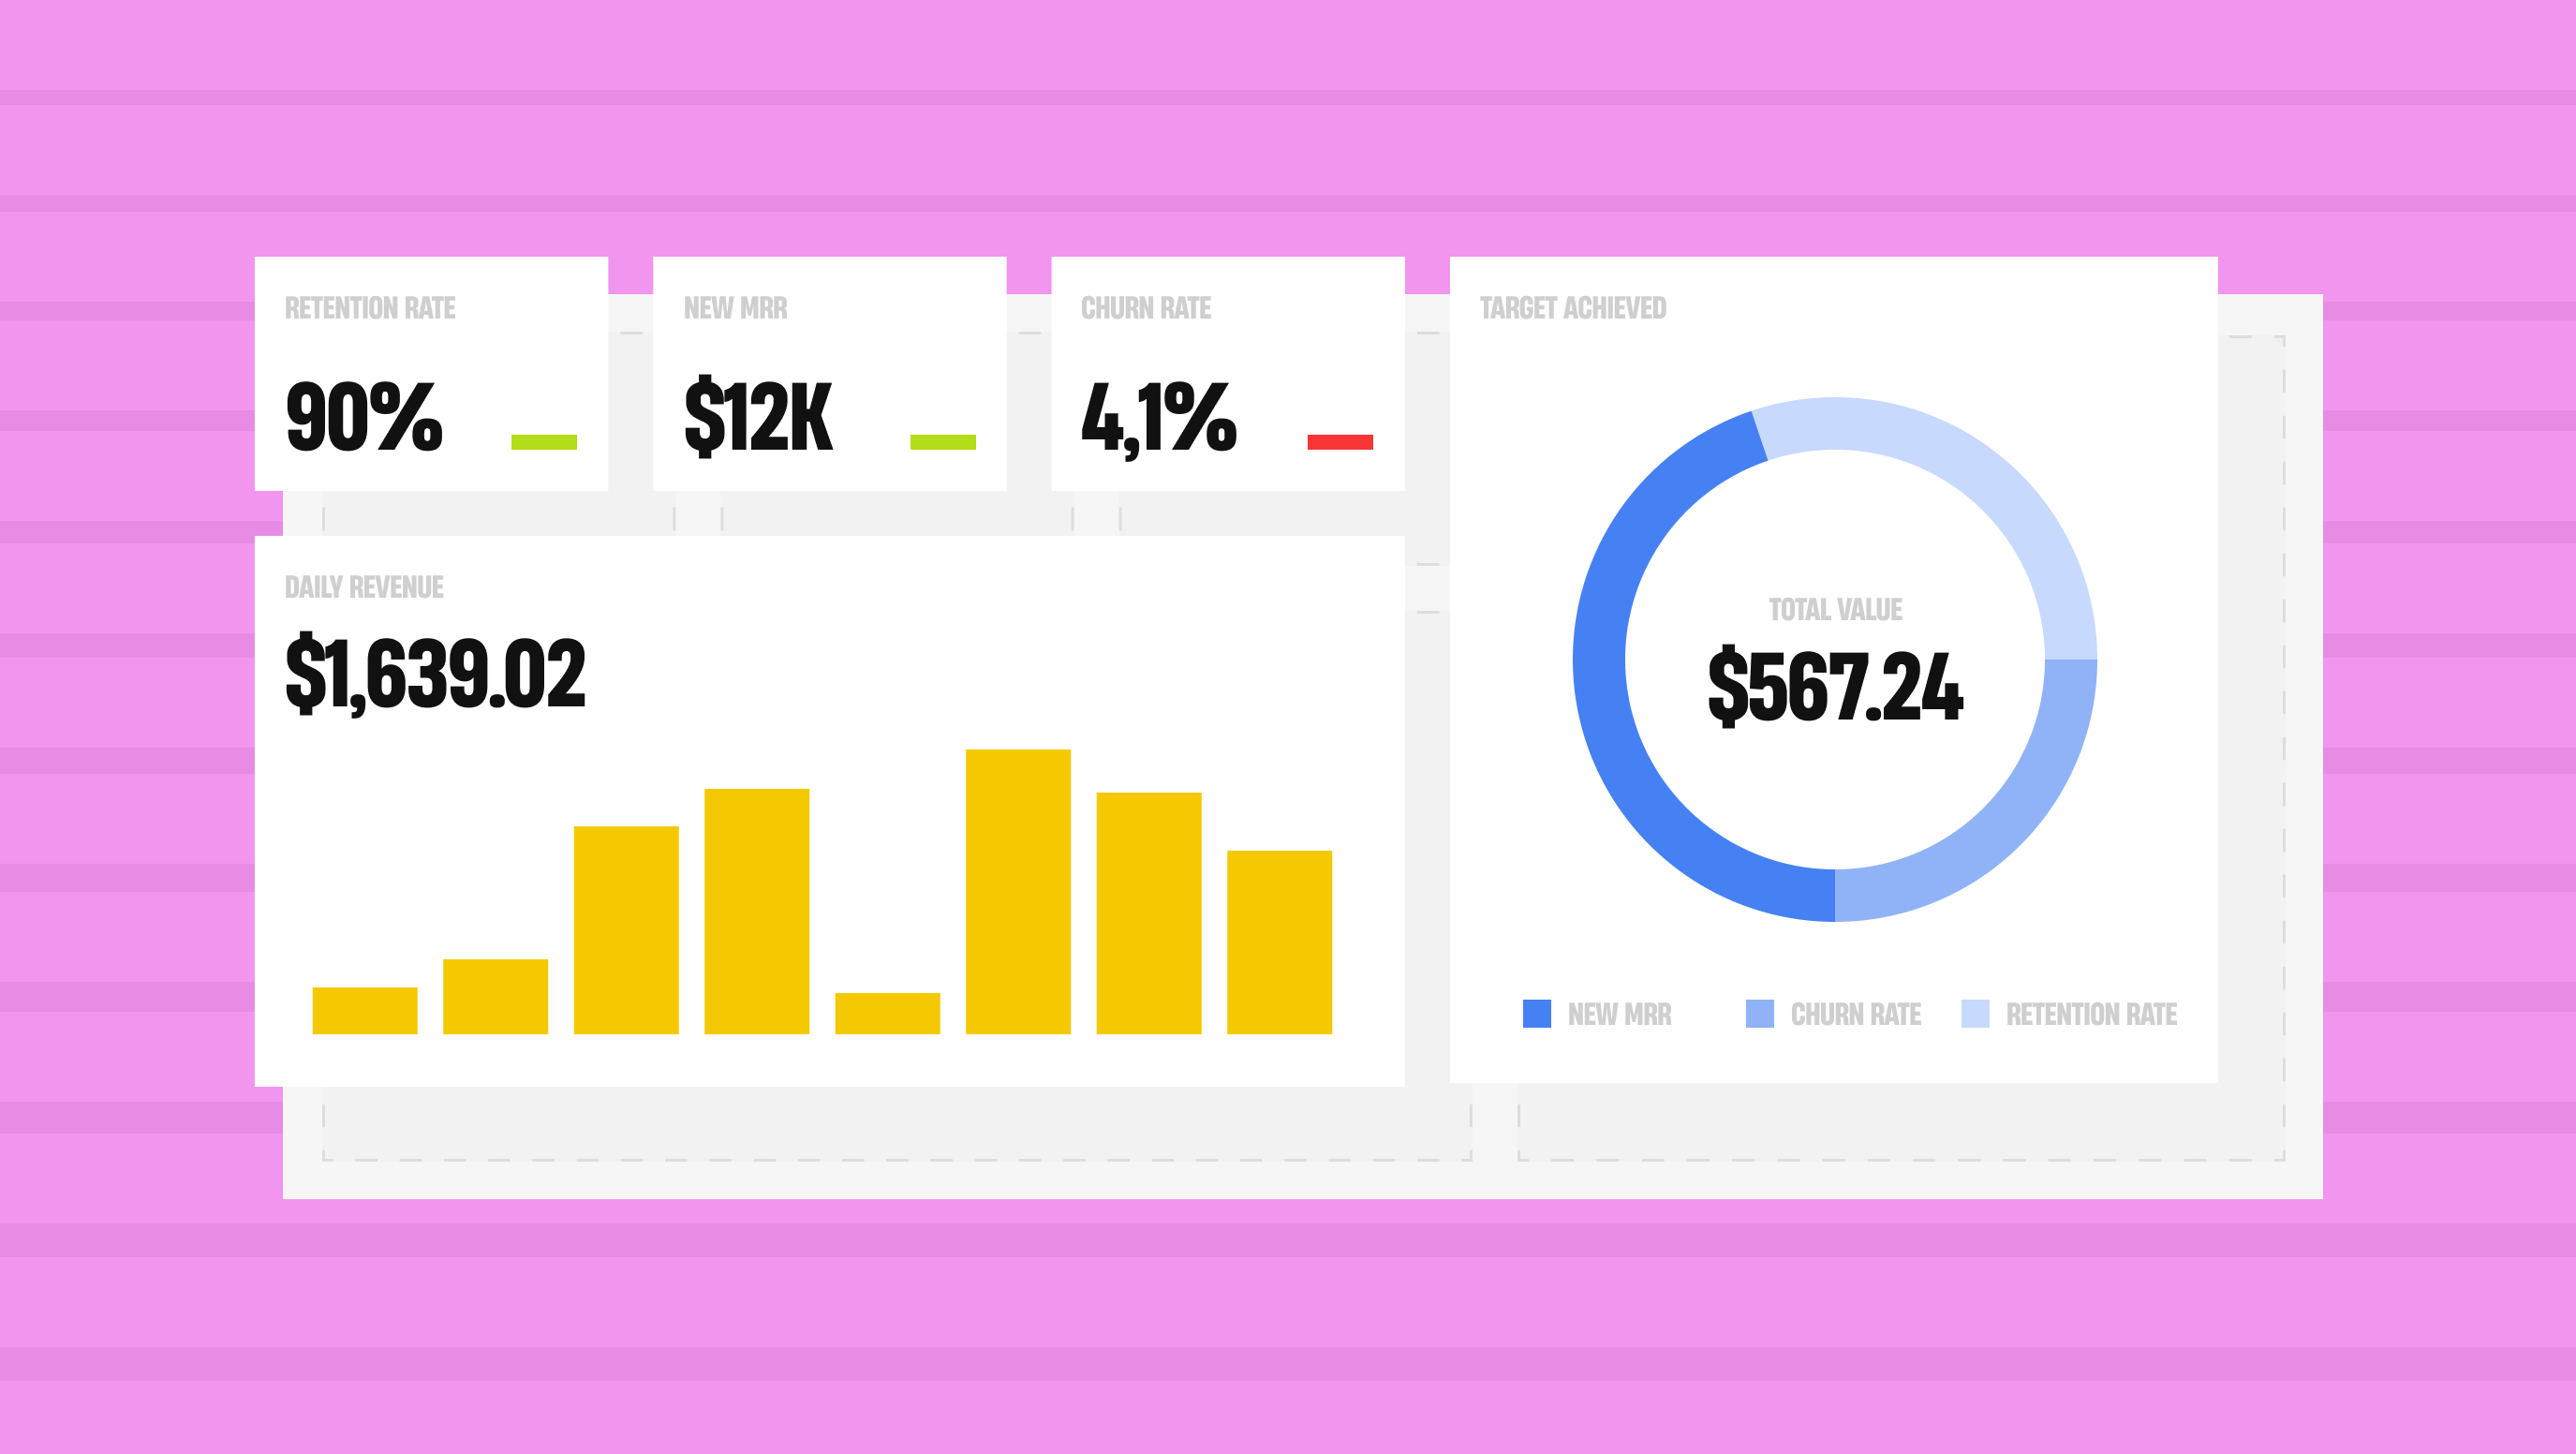
A data-heavy SaaS dashboard works when it answers one question for one audience, shows every number next to a comparison, and encodes quantities with length and position. The rest is discipline: fewer metrics per view, no decorative chart elements, colour that carries meaning but never carries it alone, and every data state designed, including empty and stale.
The 12 principles below come from our project work at Hatypo plus published research from Nielsen Norman Group, the W3C's WCAG 2.2 accessibility guidelines, and Google's Core Web Vitals thresholds for interface responsiveness.
We've delivered 20+ dashboard and SaaS projects since 2021. Most of them involved analytics screens that started simple and grew past what the first layout could hold.
What should a dashboard answer before you design a single widget?
The first 3 principles decide whether the rest matter. A beautiful dashboard that answers no particular question gets opened twice and then ignored.
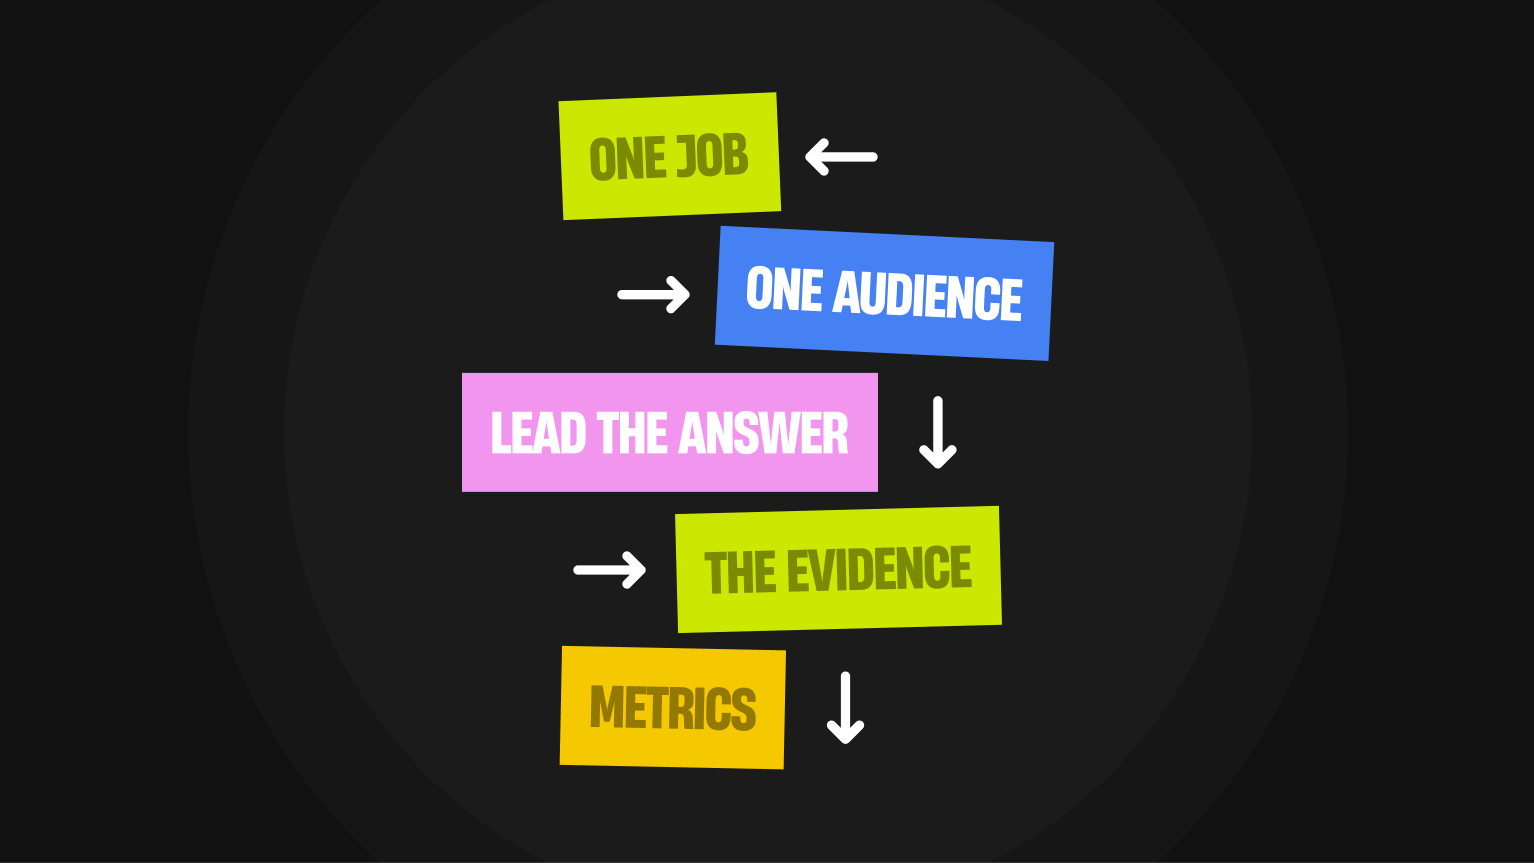
- Give the dashboard one job and one audience. A support lead watching queue health and a CFO reviewing quarterly margin need different screens, different refresh rates and different levels of detail. SAS groups dashboards into operational, analytical and strategic, and the three differ most in how often the data changes. Write the job in one sentence before you open Figma. If you can't, the dashboard isn't ready to design.
- Lead with the answer, then the evidence. Put the conclusion where the eye lands first: "Churn is 4.2%, above your 3% target" in large type, with the trend chart underneath. Users who want the raw series will scroll. Users who want the status get it in 2 seconds.
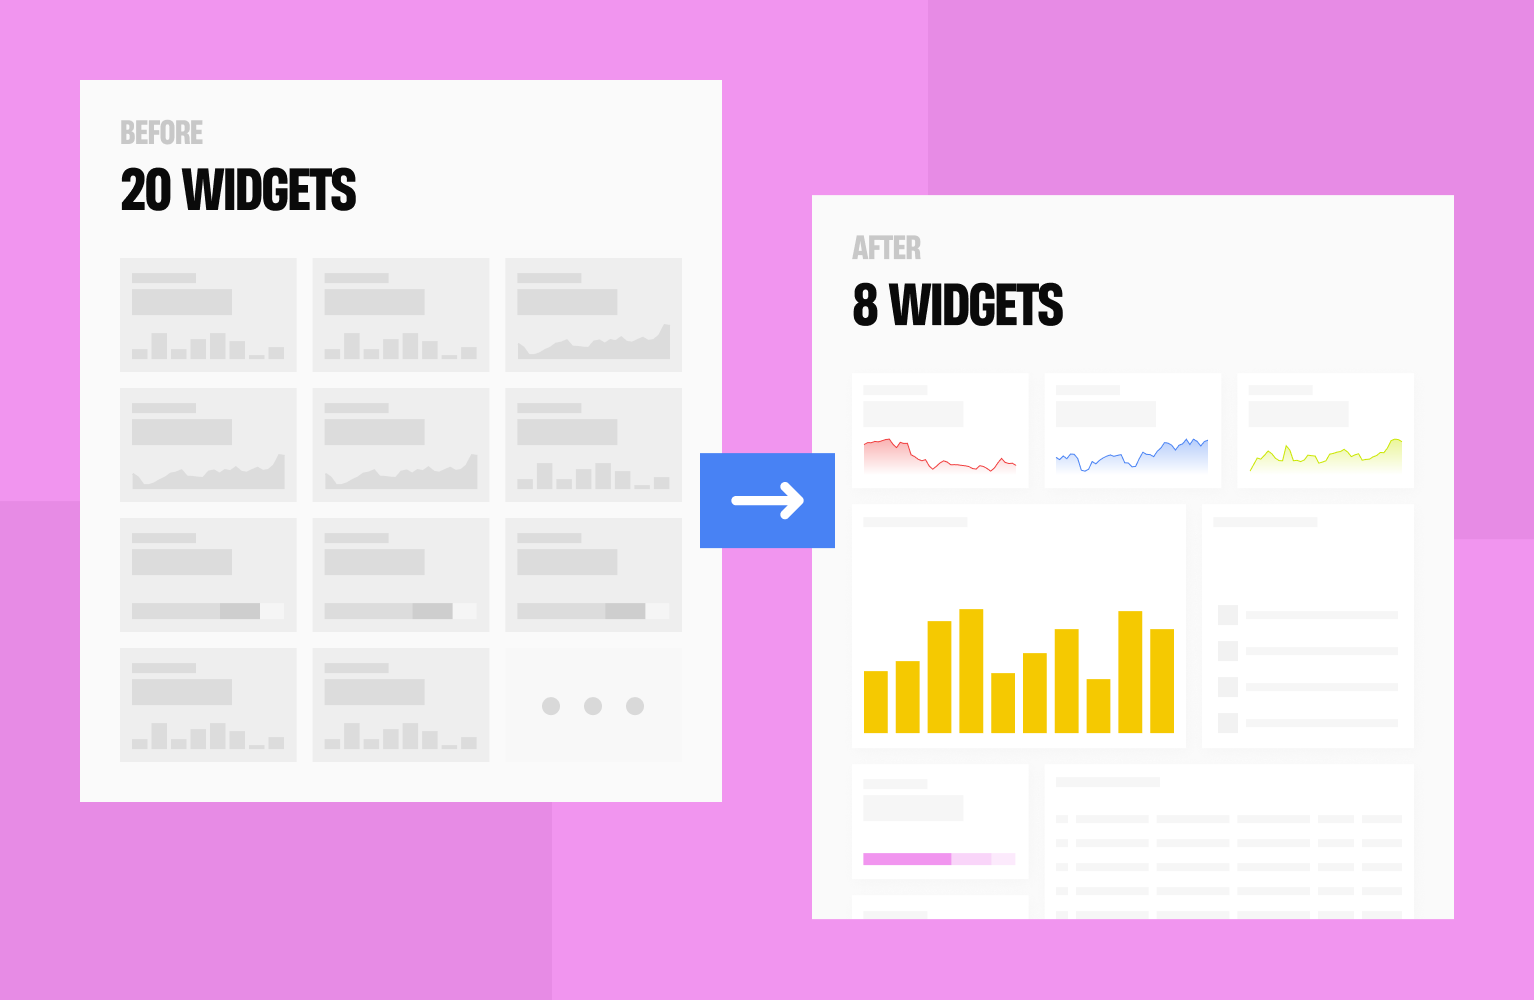
- Cap the metrics per view. We aim for 5 to 7 primary metrics on an overview, with everything else behind a tab or a drill-down. Jakob Nielsen's definition of progressive disclosure is the pattern: show the few options that serve most tasks, and put the rest one clearly labelled level down. A screen with 20 equally sized tiles has no hierarchy, so the reader has to build one.
How do you present the numbers so people read them correctly?
These 4 principles cover the part teams usually treat as decoration. It decides whether a reader gets the right answer or a plausible wrong one.
- Give every number a comparison. A churn widget reading 4.2% means nothing on its own. Add last month's 3.1% and the 3% target, and the same number now says the business is moving the wrong way. Every metric needs at least one of 3 comparisons: previous period, target, or benchmark.
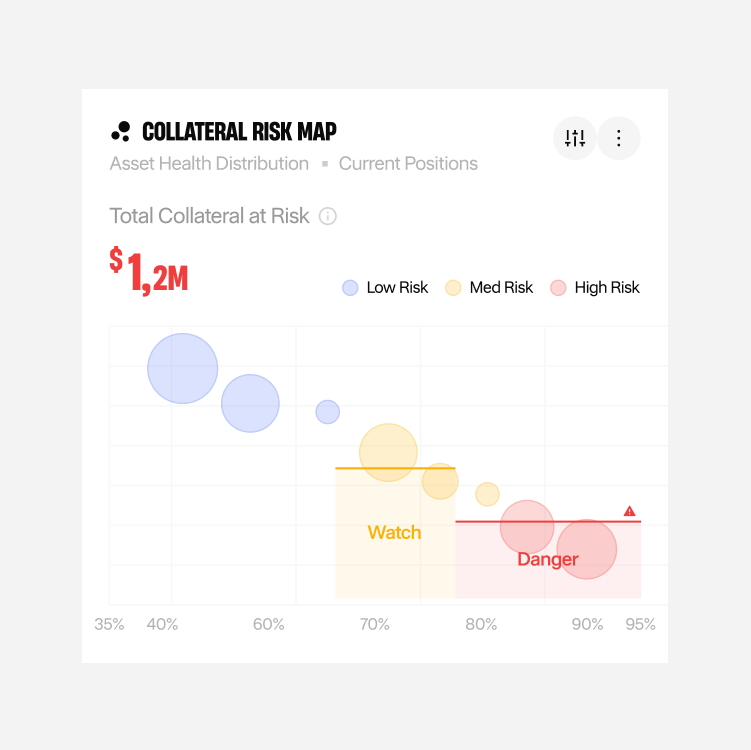
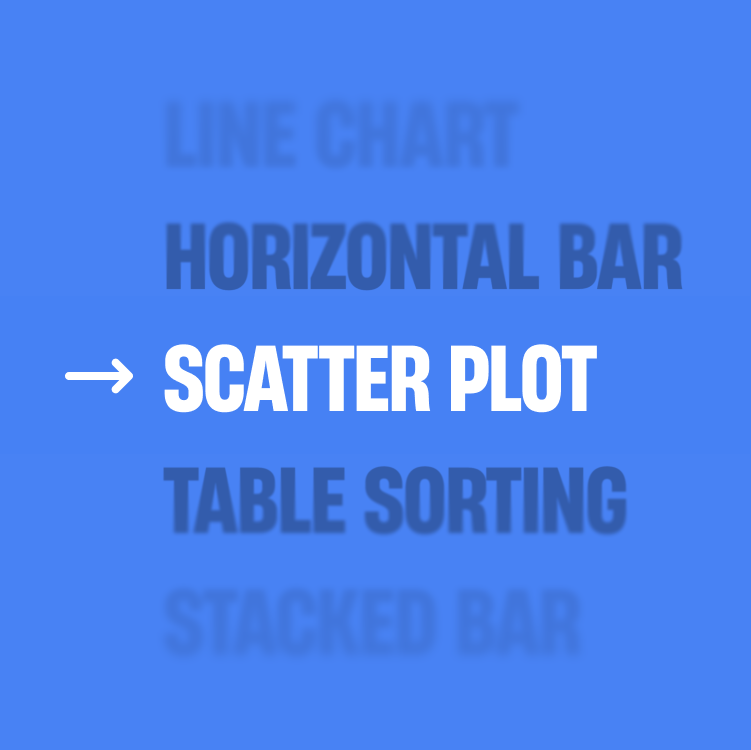
- Choose the encoding by the question. Nielsen Norman Group's guidance on dashboard visualisations is specific: length and 2D position communicate quantity fastest, because the eye processes them before conscious attention engages. Area and angle are weaker, which is why pie charts and treemaps fail at precise comparison. Use the table below as a starting point.
- Cut everything that isn't data. NN/g's rule on chartjunk is to remove elements that distract from the data. Edward Tufte coined the term in 1983. In practice: drop 3D effects, heavy gridlines, drop shadows, redundant legends and axis labels repeated on every tick. Round to 1 or 2 decimal places, because 6 decimals in a business dashboard add noise and no information.
- Use colour semantically, and never alone. Pick one colour for the primary series, one for comparison, and reserve red and amber for states that need action. Around 8% of men and 0.5% of women have a colour vision deficiency, so pair colour with a label, an icon, a pattern or position. WCAG's Use of Color criterion requires exactly this.
How do you handle live data without breaking trust?
Data-heavy products fail here more than anywhere else. The happy-path screen looks fine in Figma, then production serves a half-loaded chart over a 6-hour-old cache.
- Design all 5 data states for every widget. Loading, empty, partial, stale and error. The empty state is the one teams skip, and it's the first thing a new customer sees. Write real copy for it: what the widget will show, why it's blank, and what to do next. A chart that renders an empty grid with no explanation reads as a bug.
- Make the time range and data freshness explicit. Put the active range in the widget header, not only in a filter bar at the top of the page. Add a timestamp: "Updated 14:32, 6 Oct". Teams argue over numbers that disagree, and most of the time the 2 screens are showing different ranges or different refresh times.
- Keep interaction inside the response-time limits. Nielsen's 3 limits, drawn from Miller's 1968 research, still hold: 0.1 seconds feels instant, 1 second keeps the user's flow of thought, and 10 seconds is the edge of their attention. Google's INP threshold puts good responsiveness at 200 milliseconds or less at the 75th percentile. Sorting a table or switching a filter belongs in that first band. For anything slower, show a skeleton that matches the final layout, and render each widget as its query returns rather than holding the whole screen.
How do you keep a dashboard usable as it grows?
A dashboard is rarely finished. Customers ask for 1 more metric every quarter, and after 2 years the screen holds 40 widgets nobody planned together.
- Build on a small component set with accessibility in it. Define a widget shell, a metric tile, a chart container and a table, then build every new view from those. Set the rules once: text contrast of at least 4.5:1, non-text elements and chart strokes at 3:1, and interactive targets of at least 24 by 24 CSS pixels, which are the WCAG 2.2 AA thresholds. Fixing this later means touching every screen.
- Instrument the dashboard and cut what nobody opens. Log which widgets get viewed, which filters get changed and which drill-downs get clicked. In my experience a handful of widgets carry most of the use. Move the unused ones behind a tab or delete them, and run a usability session every few releases to check that people read the numbers the way you intended.
Heading 1
Heading 2
Heading 3
Heading 4
Heading 5
Heading 6
Lorem ipsum dolor sit amet, consectetur adipiscing elit, sed do eiusmod tempor incididunt ut labore et dolore magna aliqua. Ut enim ad minim veniam, quis nostrud exercitation ullamco laboris nisi ut aliquip ex ea commodo consequat. Duis aute irure dolor in reprehenderit in voluptate velit esse cillum dolore eu fugiat nulla pariatur.
Block quote
Ordered list
- Item 1
- Item 2
- Item 3
Unordered list
- Item A
- Item B
- Item C
Bold text
Emphasis
Superscript
Subscript
Authors :

Working with an Offshore Design Studio: What to Expect
Expect four things from an offshore design studio in Asia: a short paid test before the full project, scheduled meeting windows, written agreements on who owns the files, and international bank transfers that usually take 1 to 6 working days. At Hatypo, based in Surakarta (UTC+7), the design test takes 1 to 3 working days and project meetings run 9am to 5pm Indonesia time.
This article draws on Harvard Business School's reporting on time zone research, Indonesia's Copyright Law No. 28 of 2014 as published by WIPO, Wise's guidance on international transfers, and law-firm summaries of Indonesia's Personal Data Protection Law. The design test and meeting windows describe how Hatypo works today.
I'm Uno, an account executive at Hatypo Studio. I handle scope and budget conversations with new clients, so I hear buyers' concerns about working across borders on first calls. Hatypo is based in Surakarta, Indonesia, serves international clients, and has delivered 250+ projects with various scopes.
Why do buyers hesitate to hire a design studio in Asia?
Buyers usually worry about the same things: whether the studio's quality matches its portfolio, whether communication will hold up across time zones, who owns the work, and how money moves. Those are fair concerns, and each one has a practical answer.
Research on offshore engineering design points the same way. Three US projects that outsourced part of their design work offshore found that clients worried about trust and knowledge sharing, while vendors worried about quality control, communication and schedule control.
Design and engineering are different fields, and the same pattern applies: trust builds when you see real work and talk to the people doing it. A design test gives you both.
How does the Hatypo design test work?
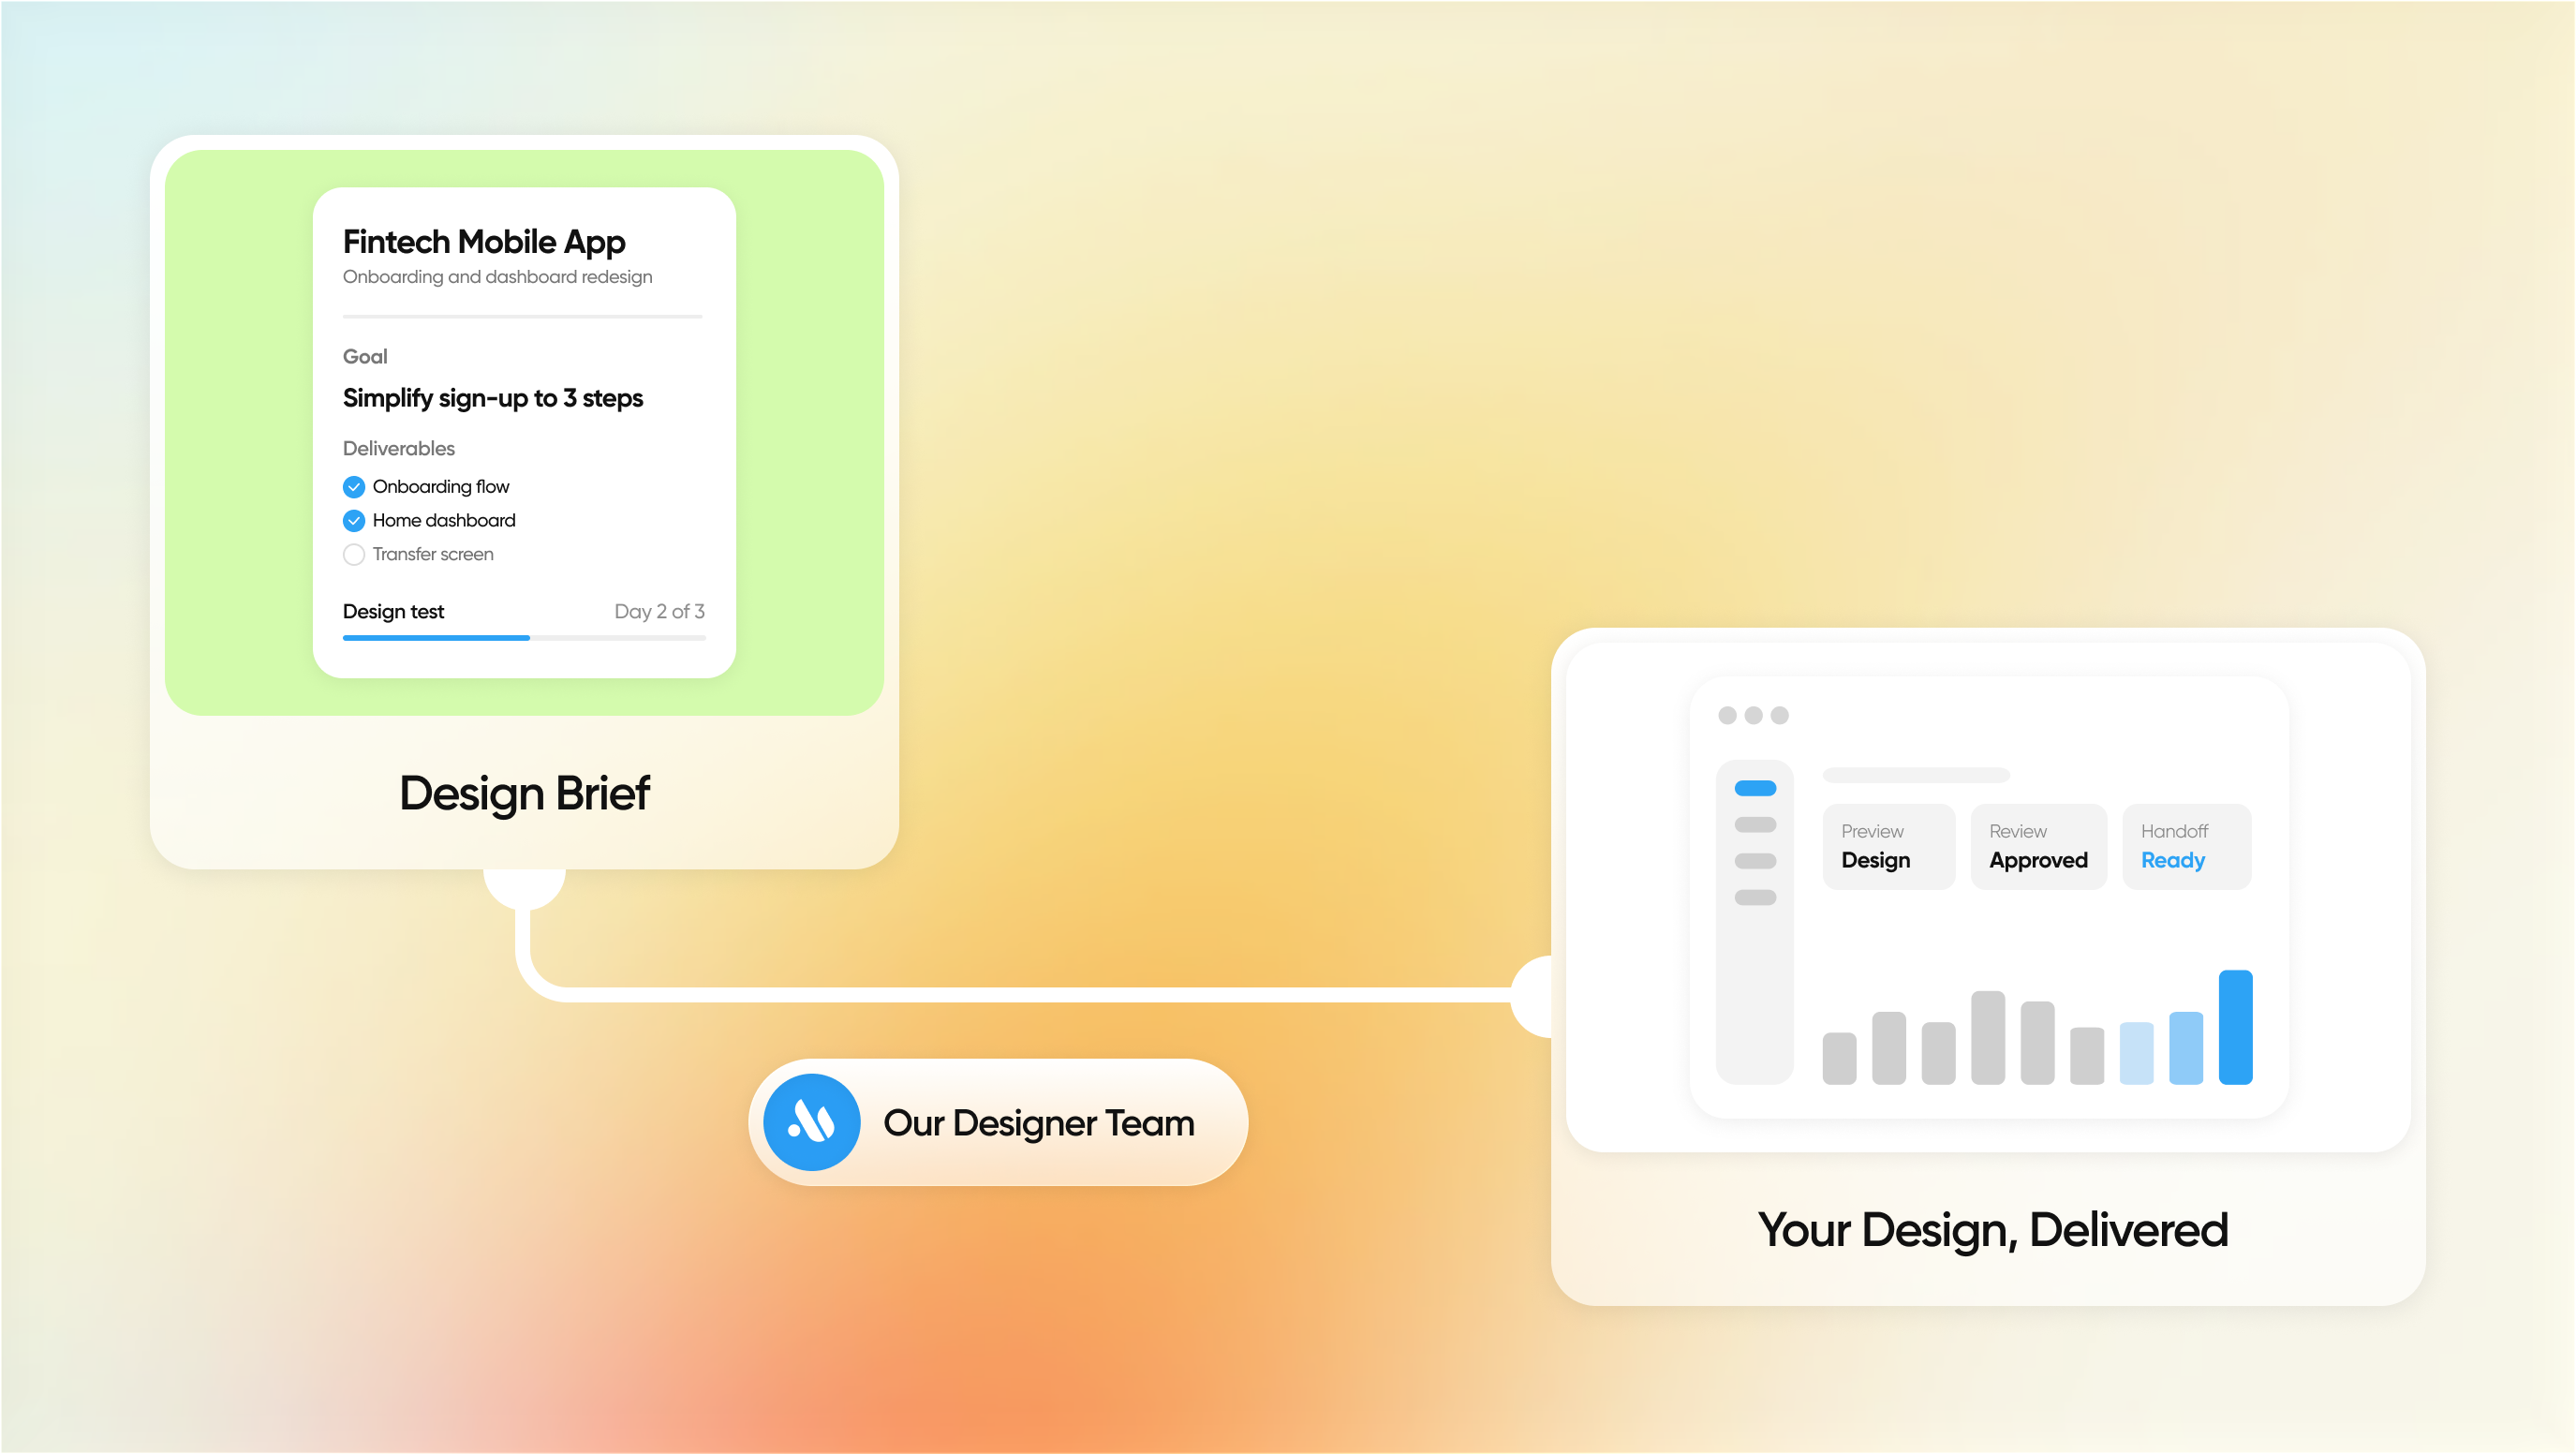
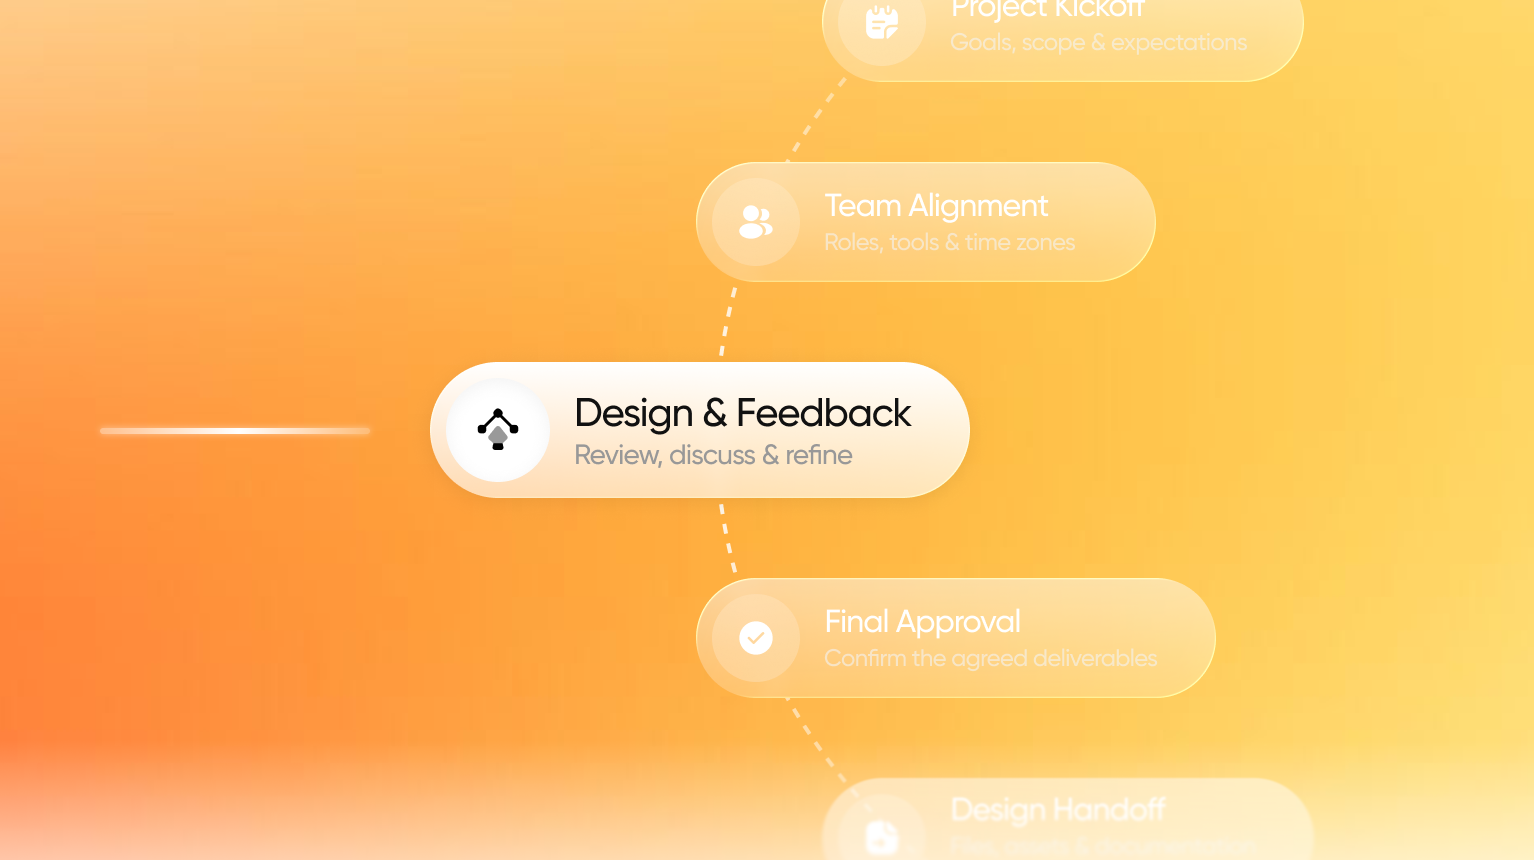
The design test is a paid, short engagement that comes before the full project. It takes 1 to 3 working days and applies to every project type we take: mobile app, web app, website and dashboard.
You give us a brief and we design against it. At the end, you have seen our output and our communication on your own problem, with your own brief as the standard.
What does the test show you?
- Our performance. How we work through your brief inside a 1 to 3 working day window.
- Our communication. How we ask questions, report progress and respond to feedback.
- The result against your brief. Whether the design answers what you asked for.
How should you prepare a test brief?
Choose a brief that matches a real problem in your product, so the result is easy to judge against what you expected. Name one person who gives feedback during the 3 to 5 days, so communication is measured on clear answers.
How do time zones change the way we work together?
Harvard Business School research on more than 12,000 employees at one multinational found that each extra hour of time difference cut real-time communication, such as calls and video chats, by 11 percent on average. Email and chat volume stayed the same.
Plan for it: with fewer live calls, written updates and clear feedback carry more of the work. For east-west teams, the researchers advise getting better at asynchronous communication and setting the expectation that answers won't be instant.
How do time zones change the way we work together?
Harvard Business School research on more than 12,000 employees at one multinational found that each extra hour of time difference cut real-time communication, such as calls and video chats, by 11 percent on average. Email and chat volume stayed the same.
Plan for it: with fewer live calls, written updates and clear feedback carry more of the work. For east-west teams, the researchers advise getting better at asynchronous communication and setting the expectation that answers won't be instant.
When can you meet the Hatypo team?
Meetings about a running project happen between 9am and 5pm Indonesia time (WIB, UTC+7). Deal meetings, such as the first call and scope discussions, can happen between 8am and 10pm WIB.
How much of your workday overlaps with ours?
This table counts the hours that fall inside 9am to 5pm local time for the client, based on UTC offsets and the time differences listed by time.is. Ranges cover daylight saving changes, which Indonesia doesn't observe.
For project calls, US clients meet us in their evening. A 9am WIB call on Wednesday is 9pm Tuesday in New York and 6pm Tuesday in Los Angeles, on standard time. Deal meetings reach the New York morning and the Los Angeles evening.
Who owns the design files when an Indonesian studio does the work?
Under Indonesia's Copyright Law, the party that produces a commissioned work is the author and copyright holder unless the parties agree otherwise (Article 36). In practice, the contract is where ownership gets decided.
Copyright can be transferred in whole or in part by several routes, including a written agreement (Article 16). The law's elucidation adds that only economic rights transfer, and that the transfer must be made clearly and in writing.
Moral rights, such as the right to decide whether the author's name appears or to object to distortion of the work, stay with the author while the author is alive (Article 5). Ask the studio how credit and later changes to the work are handled.
Indonesia ratified the Berne Convention through Presidential Decree No. 18 of 1997, according to the law's own elucidation. I'm an account executive, not a lawyer. Have your own counsel read the ownership clause before you sign.
At Hatypo, the intellectual property belongs to the client in full. Whichever studio you choose, ask for that to be stated in the contract before the project starts.
What happens to your data and confidentiality?
Most design work runs on flows, screens and sample content. Where real data is needed, agree in writing what is shared and who can see it.
Ask for a confidentiality agreement before you share product plans or user data. Hatypo signs NDAs. Once your product launches, typically 3 to 6 months later, we publish it on the Hatypo website as a delivered project, so confirm that arrangement in the contract. Fintech and healthtech buyers should raise data handling on the first call.
How do cross-border payments work?
Bank wires sent across borders in a foreign currency often travel over the Swift network. Wise's help pages say these transfers usually take 1 to 6 working days to arrive, and sometimes longer.
Banks between the sender and the receiver can deduct handling fees on the way, so the amount that arrives can be lower than the amount sent. Wise notes that these fees can come from your own bank, an intermediary or the recipient's bank.
Agree three things when you scope the project: the invoice currency, who covers transfer fees, and how many working days the first payment needs to arrive. That keeps a transfer delay from holding up the start of the work.
At Hatypo, payments usually go through Wise, PayPal, or platforms such as Contra and Dribbble. Confirm which route suits you, because each has its own fees and timing.
What should you ask any offshore design studio before you sign?
Put these 5 questions to every studio on your shortlist, including us. The answers should be specific, written down and easy to compare between studios.
- Can we run a paid test first? Ask what the test covers, how long it takes and what it costs. At Hatypo, it takes 3 to 5 working days and covers mobile app, web app, website and dashboard projects. The cost depends on scope and the number of designs, and hourly charging is also possible.
- When can we meet? Get the project meeting hours in writing and convert them to your time zone. Ours are 9am to 5pm WIB, with deal meetings from 8am to 10pm WIB.
- Who owns the files? Ask for the transfer of rights to be written into the contract. Include how credit and later changes to the work are handled. At Hatypo, the client owns the IP in full.
- How is data handled? Ask what the studio needs from you, who sees it and how confidentiality is covered. Share sample content where you can. Hatypo signs NDAs and publishes launched projects on its website 3 to 6 months after launch.
- How do payments work? Agree the invoice currency, who covers transfer fees and how long the first payment takes to arrive. Settle it before the work starts. At Hatypo, payments usually go through Wise, PayPal, Contra or Dribbble.
What four questions settle the decision?
How many hours of design work will you have each week?
Count planned work over the next 12 months. A full week of work suits an in-house hire. A few days a week suits a subscription. An uneven load of large projects suits an agency.
Who briefs and reviews the work?
Every model needs a person on your side who can say what good looks like. Without that person, an agency can supply a lead of its own. A subscription depends on the quality of your briefs.
Which skills does the work need?
List the skills the work needs, such as research, visual design, motion and front-end handoff, and mark how many one hire could cover. The gaps tell you where an agency or a subscription needs to fill in.
What happens when the work stops?
Replacing an in-house designer costs half to two times annual salary, per Gallup's estimate. An agency project ends at delivery. A subscription pauses or cancels on the provider's terms, and Designjoy lets you pause anytime.
Webflow vs Framer for SaaS Marketing Sites in 2026
By Oryza Sativa, Front End Developer at Hatypo Studio · Last updated: October 2026 · 8 min read · Websites · Development · Strategy
For most SaaS marketing sites in 2026, Webflow Premium fits content-heavy sites and Framer Pro fits design-led sites with a smaller library. Webflow Premium costs $25 a month billed yearly and holds 20,000 CMS items. Framer Pro costs $30 a month billed yearly and holds 2,500 CMS items, extendable to 40,000 with paid add-ons. Neither platform exports a full working site.
Prices and limits come from Webflow's and Framer's own pricing pages, read in October 2026, plus Webflow's May 2026 plan announcement. Performance thresholds come from Google's web.dev and the 2025 HTTP Archive Web Almanac. Third-party trackers fill gaps, and the article names them when it uses them.
I'm Oryza Sativa, a Front End Developer at Hatypo Studio. Hatypo has delivered 20+ dashboard and SaaS projects since 2021 and builds client websites in both Webflow and Framer. This comparison covers what a developer meets after the design is signed off: limits, code, performance, and hand-off.
Key takeaways
- Webflow merged its CMS and Business plans into Premium on May 13, 2026, and the plan now carries 20,000 CMS items instead of 2,000.
- Framer Pro's 2,500-item cap is the limit a content-heavy SaaS site hits first, and each extra 10,000 items costs $20 a month.
- At list price, one designer plus two content editors costs about $55 a month on Webflow and $50 on Framer, before add-ons.
- Webflow exports HTML and CSS without CMS content, and Framer exports nothing, so treat either choice as long-term.
- A/B testing starts at $299 a month on Webflow and costs $50 per 500,000 events on Framer, so price experiments before you commit.
What changed in Webflow and Framer pricing in 2026?
Webflow rebuilt its Site plans on May 13, 2026. The old CMS and Business plans became one Premium plan at $25 a month billed yearly, or $39 billed monthly. CMS items rose to 20,000, and the CMS item add-ons disappeared.
Existing sites move at their next renewal on or after June 29, 2026. Sites in Freelancer or Agency workspaces, and sites on legacy discounts from 2022 or earlier, move on or after November 16, 2026. Business-plan sites should check bandwidth: Premium includes 50 GB, where Business included 100 GB.
Framer's own pricing page now lists Free, Basic at $10, Pro at $30 and a custom Enterprise plan. Cost trackers recorded the $100 Scale plan leaving the lineup on June 16, 2026, so older comparisons may list a plan that no longer exists.
Framer also changed editor pricing in May 2026. Extra editors now cost $20 a month on both Basic and Pro, and CMS-only content editors cost $10, with viewers free.
How does Webflow vs Framer pricing compare for a SaaS marketing site?
The table compares Webflow Premium and Framer Pro, the plcans a SaaS marketing site with a blog, integration pages and a changelog would buy. All prices are list prices in USD with yearly billing unless noted, read from each vendor's pricing page in October 2026.
Sources: Webflow pricing, Framer pricing.
For a small team, the seat arithmetic decides the monthly bill. One designer plus two content editors costs $55 a month on Webflow ($25 plus two Limited seats at $15) and $50 on Framer ($30 plus two content editors at $10). Both figures exclude add-ons and tax.
Experiments and languages move the total more than seats do. A/B testing on Webflow starts at $299 a month, billed by page views, and Framer's Convert add-on costs $50 per 500,000 events. Each added language costs $20 a month on Framer, while Webflow Localize starts at $9 and scales with locales.
Which platform fits a SaaS site's CMS volume?
Take an example site with 150 blog posts, 80 integration pages, 60 changelog entries and 30 comparison pages. That is 320 CMS items, well inside Framer Pro's 2,500 and Webflow Premium's 20,000. The platforms separate when the content plan grows toward thousands of generated pages.
Framer Pro stops at 2,500 items and 10 collections. Past that, add-ons cost $20 per 10,000 items and $40 per 10 collections, capped at 40,000 items and 40 collections. Beyond the cap, limits are negotiated on Enterprise.
Webflow Premium carries 20,000 items and 40 collections, and no item add-ons exist anymore. Unpublished drafts still count toward the cap, according to one Webflow agency's 2026 guide, and a full plan blocks new items rather than edits.
A site that plans programmatic pages, such as one landing page per integration, per use case or per city, should start on Webflow or budget Framer add-ons from day one. A site that publishes a few hundred items will not meet either limit.
How do Webflow and Framer compare on performance and SEO?
A site that plans programmatic pages, such as one landing page per integration, per use case or per city, should start on Webflow or budget Framer add-ons from day one. A site that publishes a few hundred items will not meet either limit.
The 2025 Web Almanac, using July 2025 field data, found 48% of mobile sites and 56% of desktop sites passing all three. A platform sets the starting point, and what each site adds on top decides the result.
Each vendor publishes its own claims, and you should test them on your own build. Framer describes traffic-aware pre-rendering, static generation and edge image conversion to WebP and AVIF. Webflow describes AWS hosting behind a Cloudflare CDN and says it reaches 95% of the world in under 50 milliseconds.
On SaaS sites the risk often arrives after launch. Google's web.dev says tag managers can take bandwidth and main-thread time, and it has seen a correlation between tag manager size and poorer INP scores. Analytics, chat widgets and consent banners need a script budget on either platform.
Both cover the technical basics. Webflow lists custom meta tags, canonical tags, an automatic XML sitemap, robots.txt and llms.txt controls, schema markup support and per-item indexing for CMS content. Framer lists built-in SEO, sitemaps, clean metadata and llms.txt, with redirects on Pro.
Which platform is easier for marketers to edit after launch?
Webflow separates design seats from content seats. Full seats cost $39 a month, and Limited seats cost $15 for editing content or building pages with components. The Team plan costs $2,500 a month on an annual contract and adds publishing workflows, single-page publishing and 5 full seats.
Framer charges $20 a month for each additional editor and $10 for content editors who only touch the CMS, localization and on-page editing. Both paid plans cap edit seats at 10. Pro adds a staging environment and branching with previews.
Branching matters for a marketing site that ships weekly. Framer includes it on Pro, and Webflow's pricing page lists branch staging and publishing workflows under the Team plan.
Which should a SaaS team choose in 2026?
My recommendation: start a SaaS marketing site on Webflow Premium when it will publish more than 2,500 CMS items, needs more than 150 static pages, or will move to a governed team setup. The ceiling is 20,000 items, and the Team plan is the next step up.
Choose Framer Pro when the site stays under about 2,500 items, a designer owns the build, and the team wants branching and low-cost content-editor seats. At $30 a month with 10 collections, it fits a launch site, a changelog and a blog.
Whichever you pick, run three checks before launch. Price the add-ons you will need in year one. Test Core Web Vitals on a staging build with every third-party script installed. Write down who owns the site if the platform changes its pricing again.
Need help choosing or building a SaaS marketing site?
Choosing between Webflow and Framer gets easier after a short review of your content plan, your editing team and your third-party scripts.
Hatypo has delivered 20+ dashboard and SaaS projects since 2021, and projects start at $3,000 with the price following the scope.
- If you are launching a new SaaS site, we design it and build it in Webflow or Framer to match your content plan.
- If your current site is slow or converts poorly, we audit the build and fix what the audit finds.
- If your site has outgrown its first version, we plan the move to the platform that fits the next stage.
Tell us where the site stands today and we will recommend a platform: Book a consultation.
Healthtech UX Design: Accessibility, Compliance and Trust
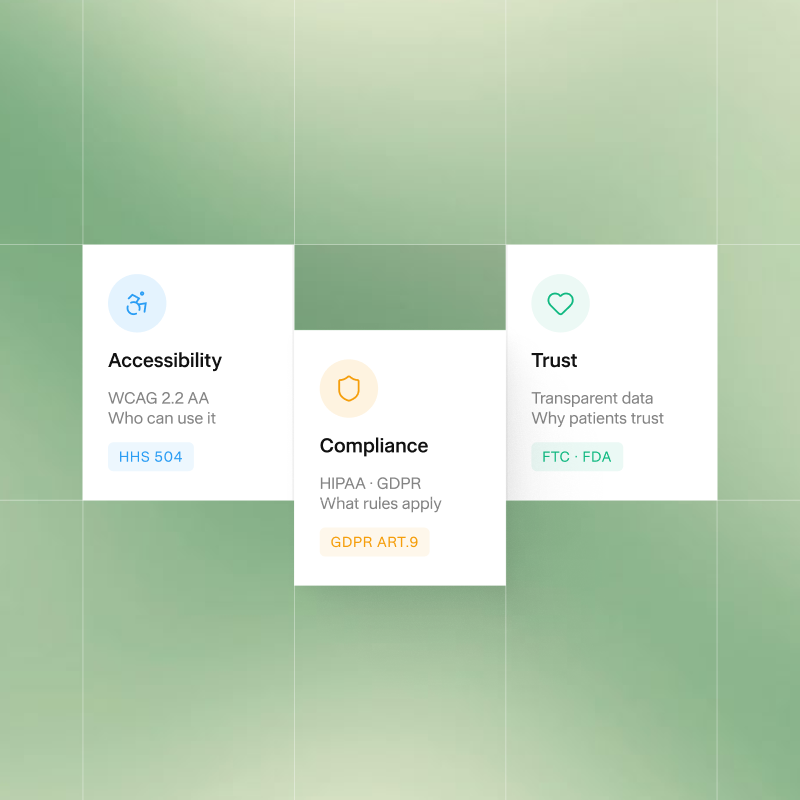
Healthtech UX works when accessibility, compliance and trust are designed as one system from the first wireframe. In practice that means building to WCAG 2.2 Level AA, which includes the 2.1 AA standard HHS requires of federally funded providers from May 2027, treating health data as a protected category under HIPAA and GDPR, and telling users plainly where their data goes.
This guide draws on the W3C's WCAG 2.2 documentation, the HHS Section 504 interim final rule, GDPR Article 7 and Article 9, the FTC Health Breach Notification Rule, the FDA's human factors guidance, and a 2019 JAMA Network Open study of health app data sharing.
I'm Adhitya, a Senior UI/UX Designer at Hatypo Studio, where our team has delivered 10+ healthtech projects since 2021. This guide covers three questions every healthtech interface has to answer: who can use it, what rules apply to it, and why a patient should trust it with their data.
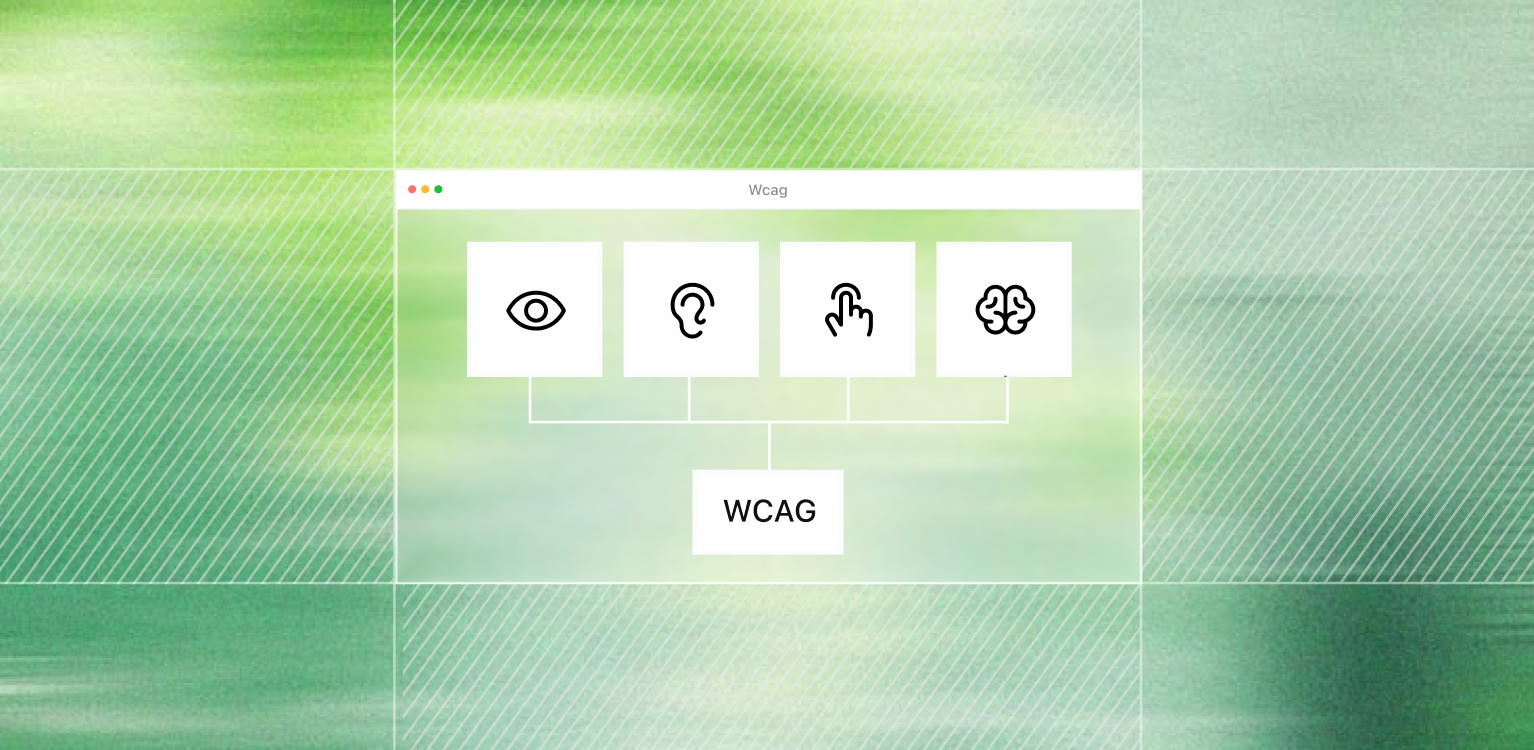
What does accessibility mean in healthtech UX?
The WHO estimates that 1.3 billion people, 16% of the world's population, experience significant disability. In healthtech, one inaccessible screen can stop someone from booking a visit, reading a result or refilling a prescription.
The current standard is WCAG 2.2, which the W3C published on October 5, 2023. It adds 9 success criteria to 2.1 and retires 4.1.1 Parsing. The six new Level A and AA criteria all change how health screens get designed:
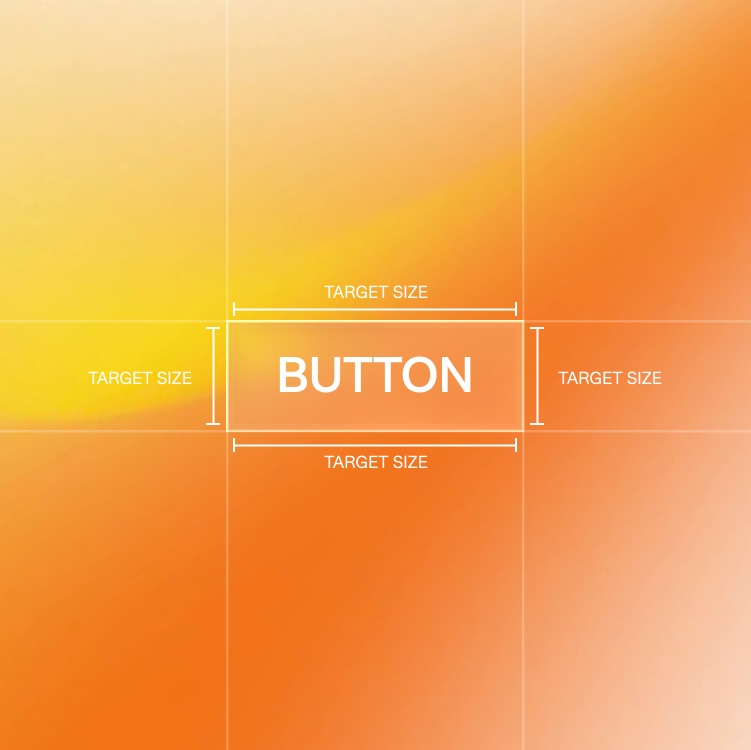
- Target Size, Minimum (2.5.8, AA). Pointer targets need at least 24 by 24 CSS pixels, or enough spacing around them (W3C). Check dose steppers, time-slot chips and close buttons first.
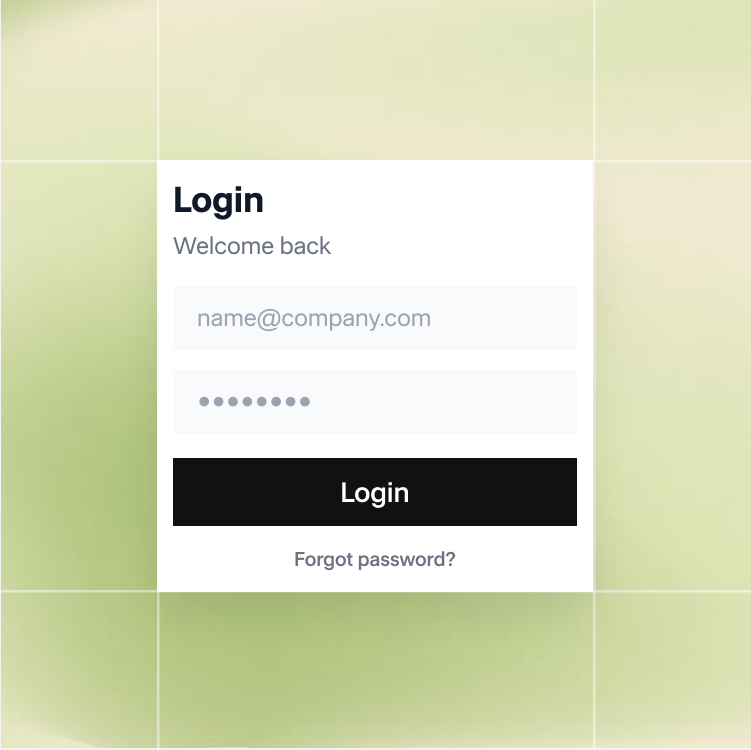
- Accessible Authentication, Minimum (3.3.8, AA). Login can't depend on memorizing or transcribing something unless an alternative exists (W3C). Allow paste, support password managers and WebAuthn passkeys, and let one-time codes autofill.
- Redundant Entry (3.3.7, A). Don't ask for details the patient already gave in the same process. An intake form that repeats date of birth on step 4 fails.
- Dragging Movements (2.5.7, AA). Any control operated by dragging, such as a pain-scale slider, needs a single-tap alternative.
- Focus Not Obscured, Minimum (2.4.11, AA). A sticky header or cookie banner can't fully cover the element that has keyboard focus.
- Consistent Help (3.2.6, A). Put help, such as a nurse line or chat link, in the same place on every page.
In the US, HHS's Office for Civil Rights pushed its Section 504 deadlines back one year in an interim final rule effective May 7, 2026. Recipients with 15 or more employees must meet WCAG 2.1 Level AA for web content and mobile apps by May 11, 2027. Smaller recipients have until May 10, 2028.
Design to 2.2 AA from the start. It keeps every 2.1 criterion except the obsolete Parsing one, so it covers the HHS standard without a second pass.
Which regulations shape a healthtech interface?
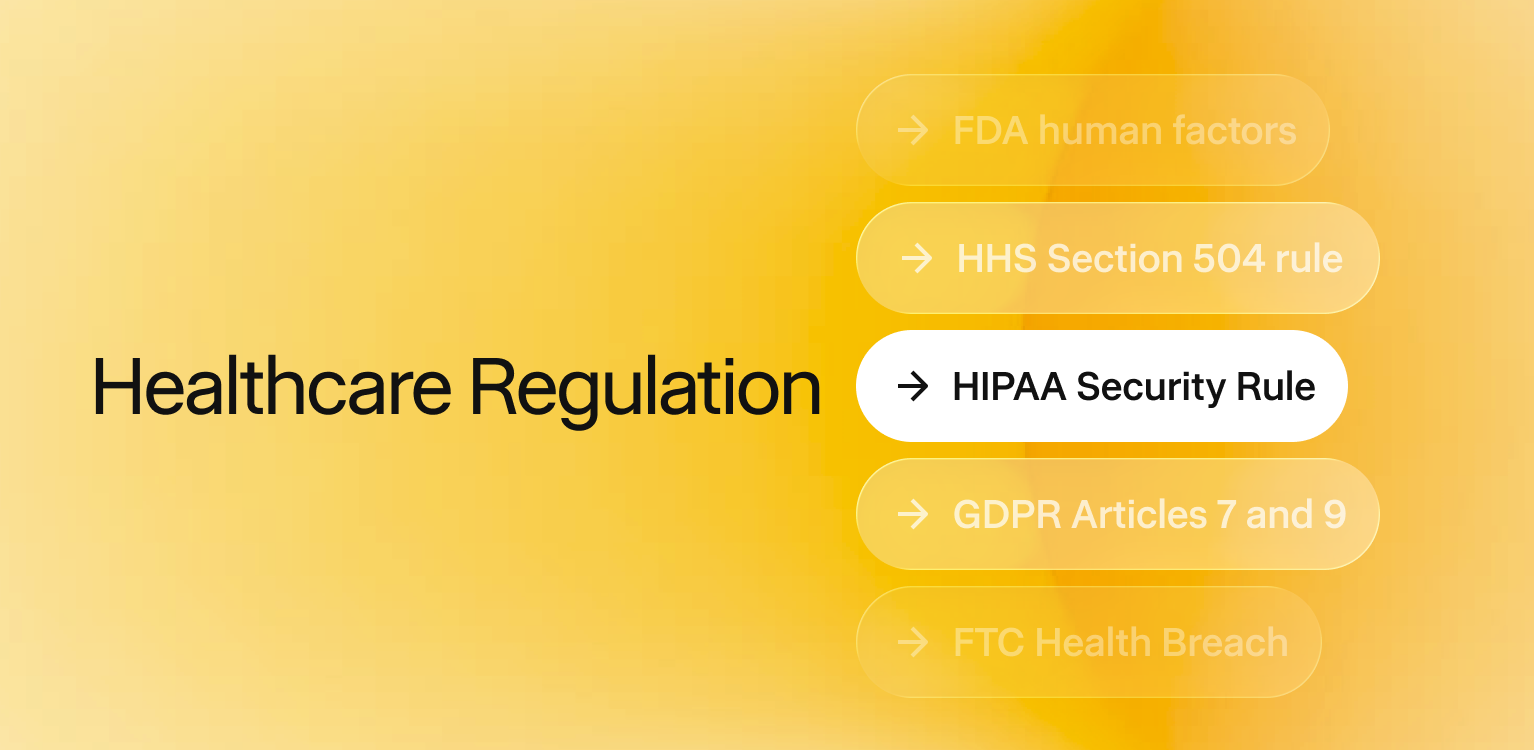
Which rules apply depends on who holds the data, what the product does, and where its users live. The table lists the ones that most often change what a screen looks like, with the design consequence of each.
HIPAA covers providers, plans, clearinghouses and their business associates. A consumer app outside that group can still fall under the FTC rule, which since its 2024 amendments names health apps not covered by HIPAA and treats an unauthorized disclosure as a breach. Consumer notices must name the third parties that received the data.
HHS has proposed a Security Rule overhaul that would require encryption, multifactor authentication and network segmentation. Fierce Healthcare reported in July 2026 that the target for a final rule slipped to July 2027. Design the MFA flow now and treat the final text as pending.
Under GDPR Article 9, health data is a special category, and processing it needs a lawful exception such as explicit consent. Explicit consent means an express statement for a specific purpose, so pre-ticked boxes and bundled terms checkboxes fail. Article 7 adds that withdrawing consent must be as easy as giving it.
If your software counts as a medical device, the FDA expects a human factors process: analyze use-related risks, then validate with representative users in realistic conditions. IEC 62366-1 is the international standard for the same process.
How do you design for trust in healthtech?
Trust starts with what the product does with data. A 2019 JAMA Network Open study by Huckvale, Torous and Larsen tested 36 top-ranked depression and smoking-cessation apps. Of those, 33 sent data to third parties, 29 sent it to Google or Facebook, and only 25 had a privacy policy.
Users can't anticipate sharing that the interface never mentions. Six practices address it:
- State the reason at the field. Put a one-line purpose beside each sensitive input, such as "We use your date of birth to match your records." A link to a policy page asks the user to leave the task.
- Audit third-party scripts. List every analytics, advertising and session-replay script on logged-in pages. Remove any whose purpose and legal basis you can't name.
- Separate consent from terms. Give each purpose one choice and no pre-ticked box. GDPR requires this for health data, and a single-purpose screen is also easier to understand.
- Make leaving as easy as joining. Put consent withdrawal and account deletion in settings, within the same number of taps as the original opt-in.
- Write at the reader's level. Use plain language, define clinical terms and spell out units. Healthy People 2030 defines organizational health literacy as the degree to which organizations enable people to find, understand and use information for health decisions.
- Show who stands behind the content. Name clinical reviewers, date medical content and keep a contact route on every page, which also supports WCAG's Consistent Help criterion.
How do you build compliance into the design process?
Compliance checks cost the least at the stage where the decision is made.
- Map the data before drawing screens. List every field, who sees it, where it is stored and which rule applies. Designers and legal share this data map, and every later screen refers back to it.
- Annotate accessibility in the design file. Add contrast ratios, target sizes, focus order and screen reader labels to each component, so developers receive the criteria together with the design.
- Design the consent and failure states first. Consent, session timeout, lockout, failed login and error screens carry compliance duties and usually get designed last.
- Test with the users who struggle most. Recruit people who use screen readers, have low vision or limited motor control, and have low health literacy. For regulated devices, run the FDA-style validation with representative users.
- Keep an evidence file. GDPR Article 7 requires you to be able to show that consent was given, so log the consent text version and a timestamp with each choice. Store audit reports and test notes beside it.
- Re-audit every release. Rules and deadlines keep moving: HHS extended its Section 504 dates in May 2026, and the HIPAA Security Rule target slipped to July 2027. Add an accessibility check to each release.
Planning a healthtech product that has to be accessible and compliant?
Healthtech screens carry accessibility, privacy and safety duties at the same time, and the design work moves faster when those constraints enter at the wireframe stage.
Hatypo Studio has delivered 10+ healthtech projects and 20+ dashboard and SaaS projects since 2021; projects start at $3,000 and the price follows the scope.
- If you're starting a new healthtech product, we design the screens, flows and consent patterns around WCAG 2.2 AA from the first wireframe.
- If your existing portal or app loses patients at login or intake, we audit those flows against WCAG 2.2 and redesign the steps that fail.
- If your product has outgrown its first version, we rebuild the design system so every component carries its accessibility and consent rules.
Tell us which stage you're at and we'll scope it together: Book a consultation.